Introducing Flytrap
Flytrap is an open-source, self-hosted error monitoring tool designed for small to mid-sized development teams. Flytrap's core objective is to offer developers a lightweight alternative to existing error monitoring solutions. These are often bloated with additional observability tools, while Flytrap focuses solely on error detection and resolution. It was designed to provide development teams with a straightforward setup process, ease of use, and ownership of both data and architecture.
This case study explores the technical domain of error handling, the challenges developers face with traditional error monitoring tools, and Flytrap’s approach to addressing these gaps. It provides a close look at Flytrap’s architecture and concludes with a discussion of engineering challenges and key implementation decisions.
Why Error Monitoring Matters
Modern applications continue to grow increasingly complex. Distributed architectures, microservices, and client-server integrations introduce the risk of countless potential failure points. Silent failures are often a significant threat in modern applications. Unlike bugs caught during testing or staging, silent failures frequently escape detection until they manifest as poor user experiences. Common outcomes of uncaught errors include loss of users, lost revenue, and damage to a product or company’s reputation.

Development teams often expect users to serve as the first point of feedback for production errors. However, relying on users to report broken functionality or unexpected behavior is an inherently flawed approach to error monitoring. Users often don’t take the time to report issues with an application. When they do, they rarely provide sufficient technical details about the failure, which makes it challenging for developers to recreate. By the time an error is reported, relevant contextual information is often missing. This can make the process of diagnosing and resolving the issue more difficult and time-consuming than it needs to be.
Exploring the Technical Domain of Error Monitoring
Programming errors can range from straightforward syntax mistakes to complex unhandled exceptions, and each requires a tailored approach to identify and resolve. Effectively addressing the potential range of issues that can arise in an application requires understanding how errors can differ between languages and frameworks and how error behavior can vary across different parts of an application.
Frontend Errors: Synchronous and Asynchronous Complexities
Frontend error monitoring must address errors across diverse user devices, browsers, and network conditions. Key error types include:
-
Synchronous Errors: Occur immediately during execution, such as invalid operations or undefined variables. While easy to identify, they become harder to isolate in complex architectures.
-
Asynchronous Errors: Arise in non-blocking operations like API requests or user-triggered events. These often manifest as silent failures, cascading into UI issues that are difficult to trace.
-
Contextual Challenges: Debugging often requires metadata like user actions, browser state, and network conditions to provide the context needed for root cause analysis.
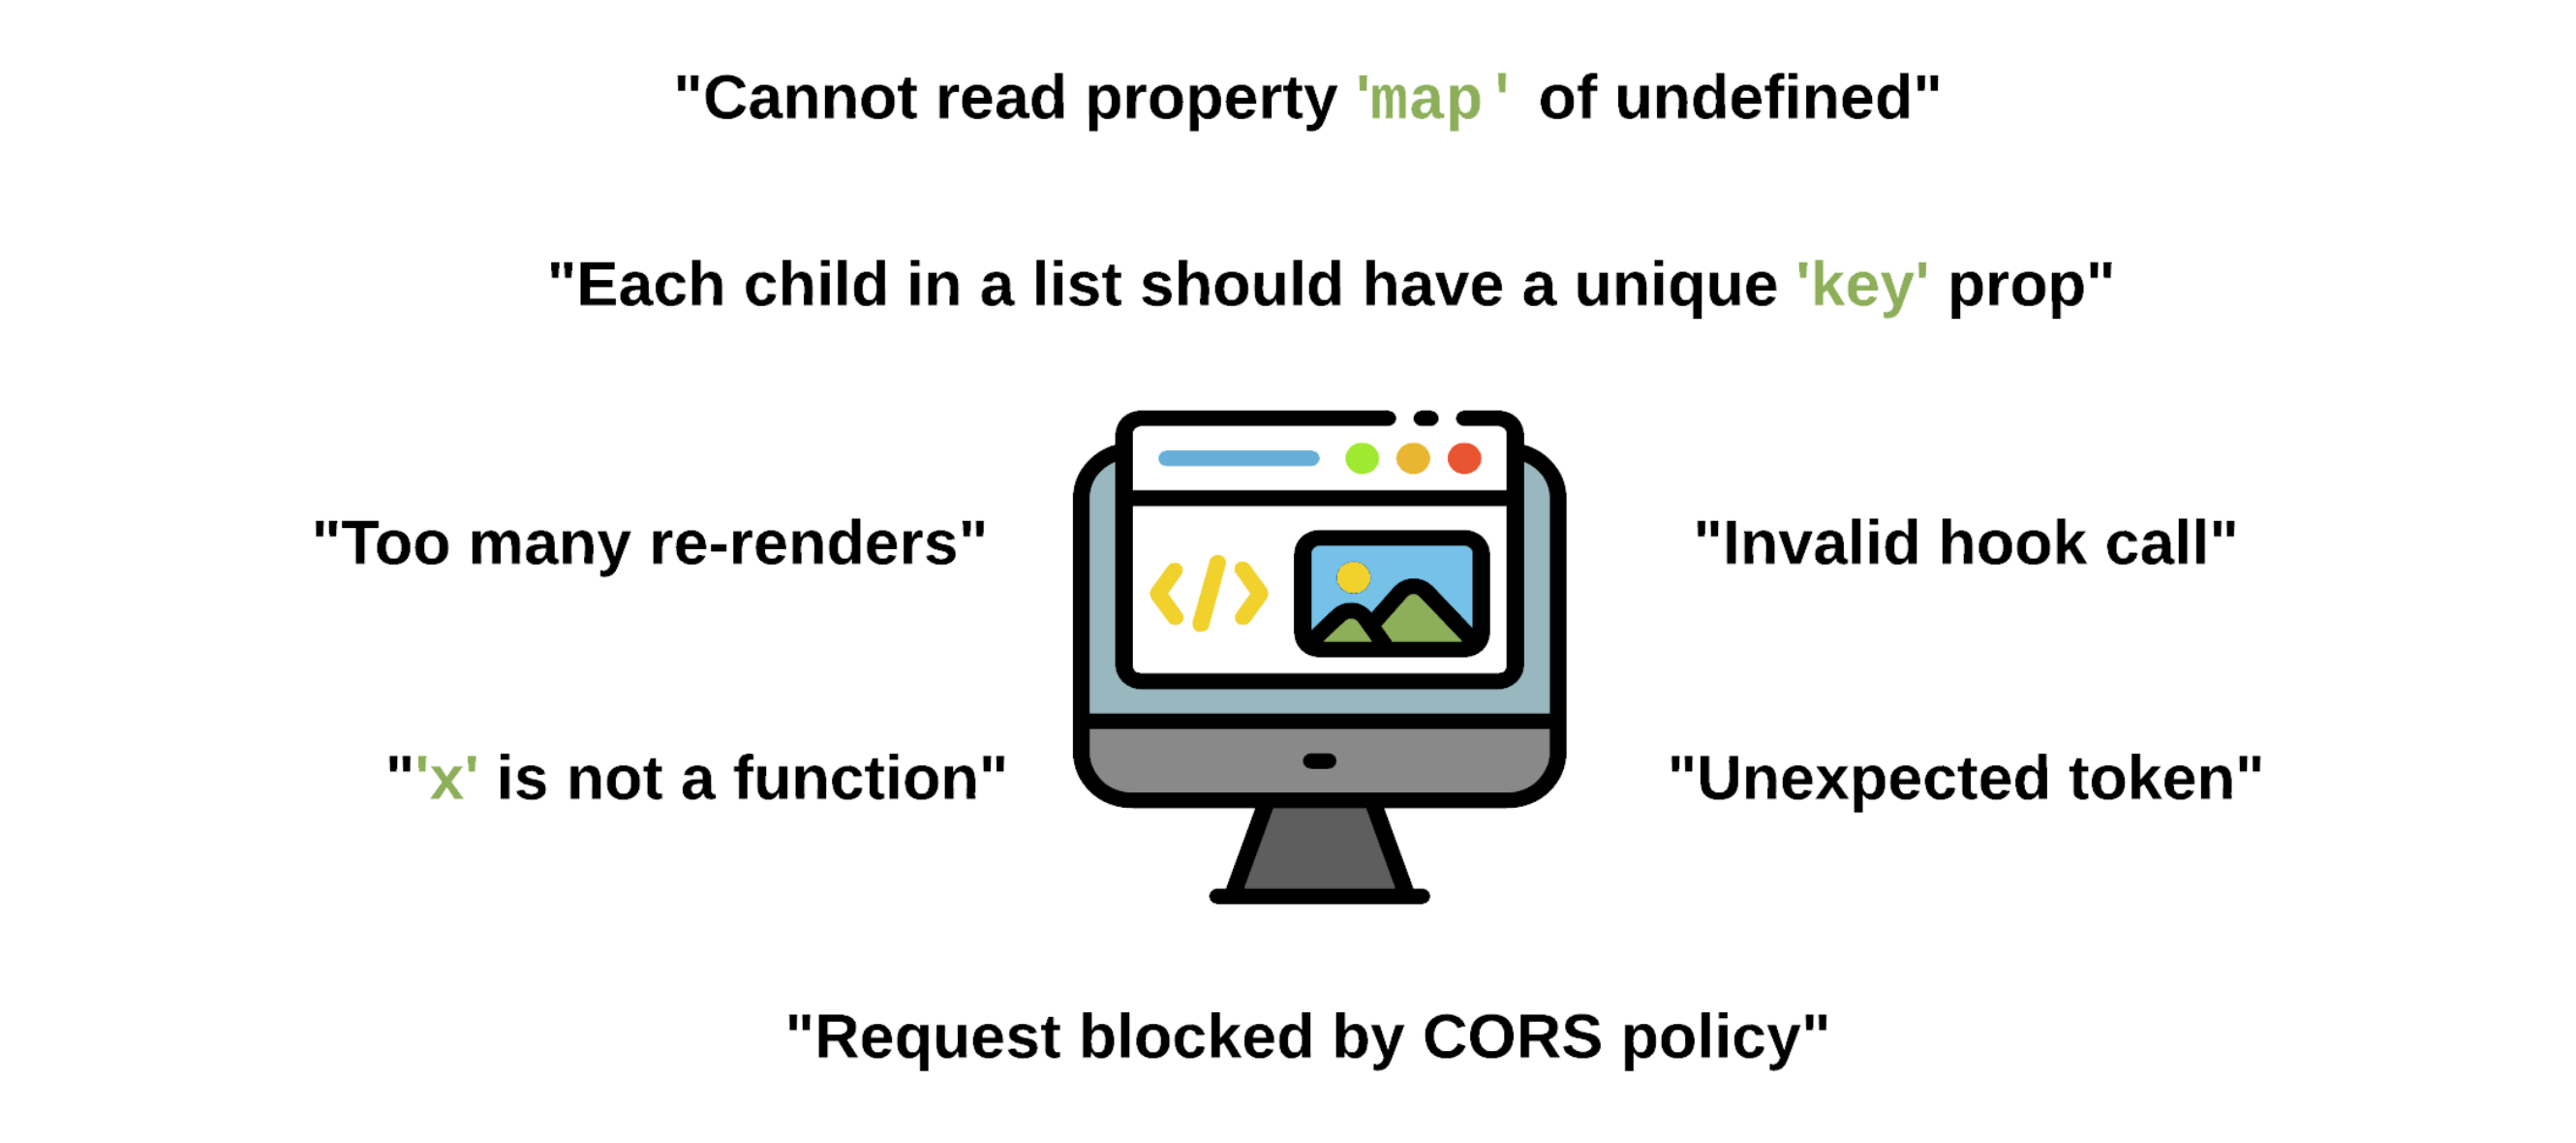
Modern frontend applications operate in diverse and unpredictable environments, presenting unique challenges for identifying and resolving errors.
Backend Errors: Framework-Specific Approaches
Backend monitoring focuses on capturing issues with server-side execution. This requires awareness of how errors are handled in different languages and frameworks:
-
Middleware-Based Errors: Frameworks like Express use middleware1 chains to manage the flow of requests and errors, but these can fail to capture issues with dynamically loaded resources or asynchronous operations.
-
Exception-Driven Errors: Frameworks like Flask rely on Python's exception hierarchy2 for fine-grained error handling, but this can miss errors raised outside of standard exceptions.
-
Unhandled Runtime Errors: Tools like Node.js's
process.on('unhandledRejection')3 and Python'ssys.excepthook4 catch critical exceptions but often lack complete context, which complicates debugging.
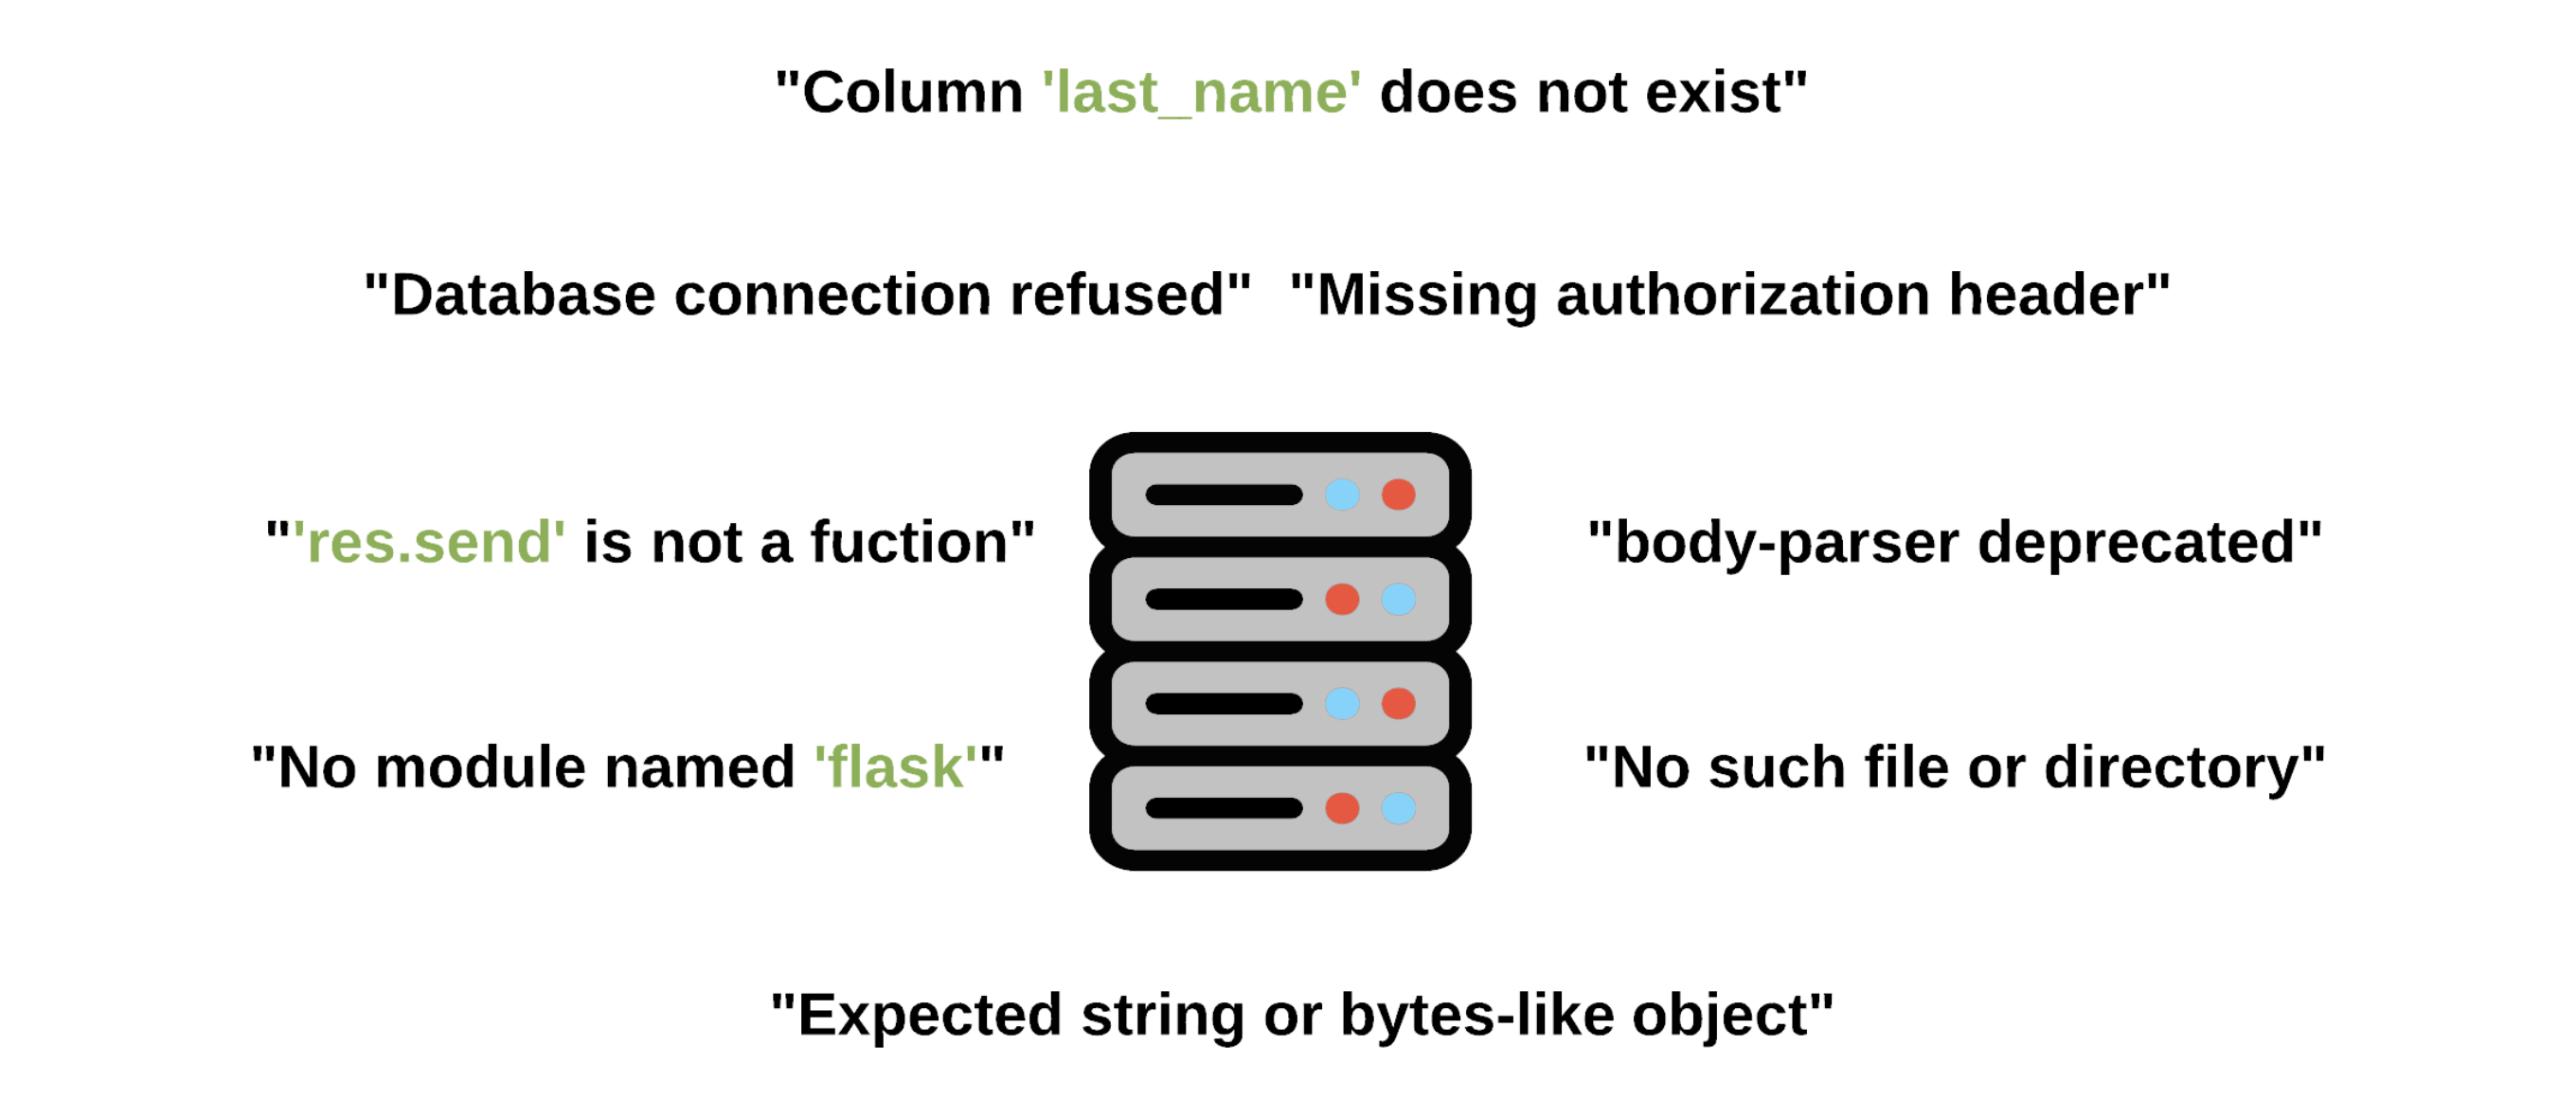
Common reasons for errors during server-side execution include API failures, database errors, and unhandled exceptions. Each backend framework introduces unique patterns and conventions for handling errors, which complicates the creation of a unified monitoring strategy.
Bridging Frontend and Backend Challenges
The relationship between frontend and backend errors introduces additional complexity. Frontend errors often cascade into backend issues, such as invalid API calls or malformed data requests. Conversely, backend errors can propagate to the frontend, manifesting as unexpected UI behaviors or incomplete data rendering.
Ensuring a cohesive error-monitoring strategy requires:
-
Consistent Error Context: Capturing and correlating contextual data (e.g., user actions, session information) across the stack to diagnose issues effectively.
-
Unified Framework Coverage: Understanding and adapting to the unique error-handling paradigms of each framework, from middleware chains in Express to decorator-driven error handling in Flask5.
-
Handling Silent Failures: Identifying and addressing errors that do not immediately surface, such as intermittent API failures or ignored exceptions in asynchronous code.
Designing robust, responsive, and resilient error monitoring software begins with recognizing the similarities and differences in error-handling paradigms across frontend and backend environments and identifying how to handle disparities in a standardized manner.
Key Components of Error Monitoring Software
Error monitoring tools typically consist of a few core components that help facilitate the detection, analysis, and resolution of errors in real-time.
SDKs for Error Collection
Error monitoring software development kits (SDKs) are directly added to application code to capture and report issues. Most tools offer platform-specific SDKs tailored to specific languages, frameworks, and libraries, with frontend- and backend-specific integrations.
Neal Real-Time Alerting
Tools for error monitoring usually include near real-time notifications to alert development teams of critical issues as soon as they occur, regardless of whether users report application failures.
Context-Rich Reporting
Error reports often capture stack traces, user session data, and metadata about device specifications, network conditions, and browser types. Context-rich reporting helps developers pinpoint root causes, which reduces time spent debugging.
Dashboards and Analytics
Dashboards offer a centralized visual representation of error trends, allowing teams to monitor application issues at a glance. These interfaces often include customizable widgets for tracking key metrics like error frequency, affected users, and resolution times.
Positioning Flytrap in the Error Monitoring Landscape
Error monitoring tools frequently expand their scope to include observability tools, performance metrics, and infrastructure monitoring. Sentry, Rollbar, and Bugsnag are just a few examples of such tools. Other top error monitoring systems, like those offered by Datadog and New Relic, are add-ons to observability-first platforms. The trend of combining error monitoring and observability tools introduces several challenges for teams focused solely on debugging.
For some teams, the use of third-party servers to store error data may also raise concerns about data ownership and privacy. Flytrap was developed to address these core gaps in existing error monitoring solutions.
Common Shortcomings of Error Monitoring Software
Many modern error monitoring tools have expanded their scope to include observability, performance metrics, and infrastructure monitoring. Sentry, Rollbar, and Bugsnag are just a few examples of such tools. Other top error monitoring systems, such as those offered by Datadog and New Relic, are add-ons to observability-first platforms. While valuable in some contexts, the trend of combining error monitoring and observability tools introduces several challenges for teams focused solely on debugging.
Overengineered Solutions
Many tools generate vast amounts of auxiliary data, such as application performance insights or infrastructure-level metrics. This data is often irrelevant and makes the debugging tool harder to navigate.
Performance Overhead
Larger platforms often implement extensive data collection to support broader monitoring and observability features, introducing unnecessary overhead in systems where teams are focused solely on error-tracking functionality.
Lack of Data Privacy and Control
Most tools store error data on third-party servers, which introduces potential risks for teams managing sensitive applications. While some offer self-hosted versions, these often involve enterprise-level pricing and complex setup, making them less accessible for smaller teams or organizations with limited resources.
How Flytrap Addresses These Challenges
Focused Functionality
Unlike general-purpose platforms that combine error monitoring with observability, Flytrap was designed to focus solely on error detection and reporting. This specificity allows teams to concentrate on resolving issues rather than navigating extraneous features that go unused by development teams that don’t need performance metrics and observability features.
Minimal Overhead
Flytrap’s SDKs are built to collect only the data necessary for debugging, minimizing their impact on application performance. The lightweight design adds minimal performance overhead, making Flytrap a practical choice even for resource-constrained applications.
Infrastructure Independence
A central element of Flytrap’s design is infrastructure independence and data ownership. Flytrap uses automated resource provisioning to deploy all infrastructure on a team’s AWS account. This gives organizations complete control over their error data, allowing users to customize their infrastructure as needed while avoiding vendor lock-in. This also means full ownership and control over sensitive error data and source code, mitigating concerns about third-party storage and privacy.
Comparative Analysis
A side-by-side comparison of Flytrap and other established tools highlights its position in the error monitoring landscape:
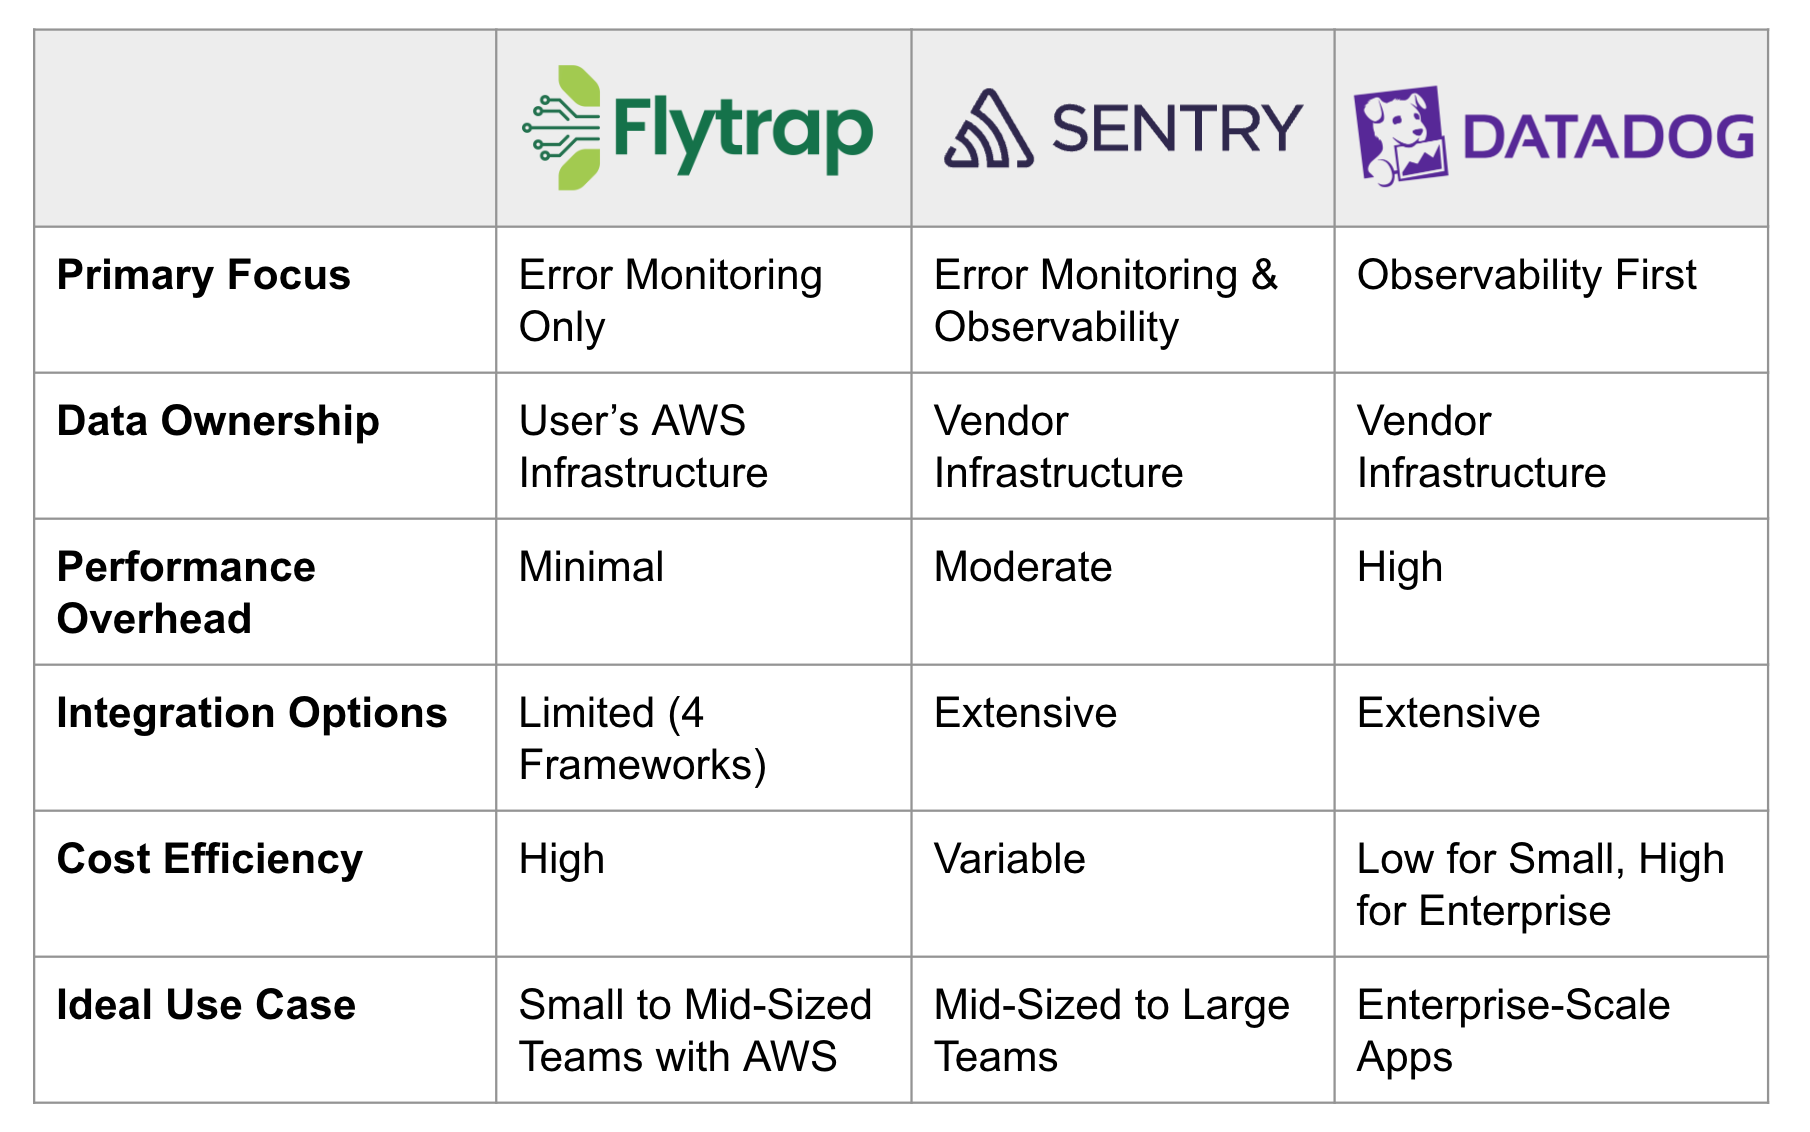
This comparison underscores Flytrap’s niche: a lightweight tool designed for small to mid-sized development teams that prioritize efficient error monitoring, data ownership, and infrastructure control without the distractions of observability or performance tracking.
Flytrap is ideal for teams that value simplicity, transparency, and privacy. It may not be the right choice for teams seeking fully integrated observability, those without access to AWS, or those requiring more advanced security features.
Flytrap Architecture
Flytrap's architecture was designed for scalability, security, and user-controlled infrastructure. The platform is fully provisioned via Terraform and hosted within the user's AWS account.

The upcoming sections explore each component of Flytrap’s architecture in detail, following the journey of an error from capture to resolution.
SDK Development: Cross-Platform Error Handling
Flytrap SDKs integrate into existing applications, enabling developers to monitor errors across various languages and frameworks, including JavaScript, React, Express, and Flask. The SDKs feature a modular structure that simplifies integration for developers. The SDKs can be installed as npm/PyPi packages, or using a script tag in the case of the Javascript SDK. Once the SDK is installed, developers can add the Flytrap configuration code to their application.
// CommonJS
const flytrap = require("flytrap_express");

// ES6 Modules
import flytrap from "flytrap_express";

// Initialize Flytrap with your project credentials
flytrap.init({
  projectId: "YOUR_PROJECT_ID",
  apiEndpoint: "YOUR_ENDPOINT",
  apiKey: "YOUR_API_KEY",
});
Captured errors are automatically transformed into a unified JSON schema that includes details like name, message, stack trace, code context, and metadata (e.g., method, path, OS, browser, and runtime). This standardized format ensures compatibility with the Flytrap backend. Once errors are captured and formatted, the SDK securely transmits the JSON payloads to the Flytrap AWS architecture, where the error processing pipeline begins.
{
  "data": {
    "error": {
      "name": "TypeError",
      "message": "Cannot read property 'foo' of undefined",
      "stack": "at app.js:42:13"
    },
    "codeContexts": [
      {
        "file": "app.js",
        "line": 42,
        "column": 13,
        "context": "function example() { return foo.bar; }"
      }
    ],
    "handled": false,
    "timestamp": "2014-11-22T10:00:00Z",
    "project_id": "project-id-123-456",
    "method": "GET",
    "path": "/example",
    "ip": "192.168.1.1",
    "os": "macOS",
    "runtime": "Node.js"
  }
}
Entry Point: API Gateway
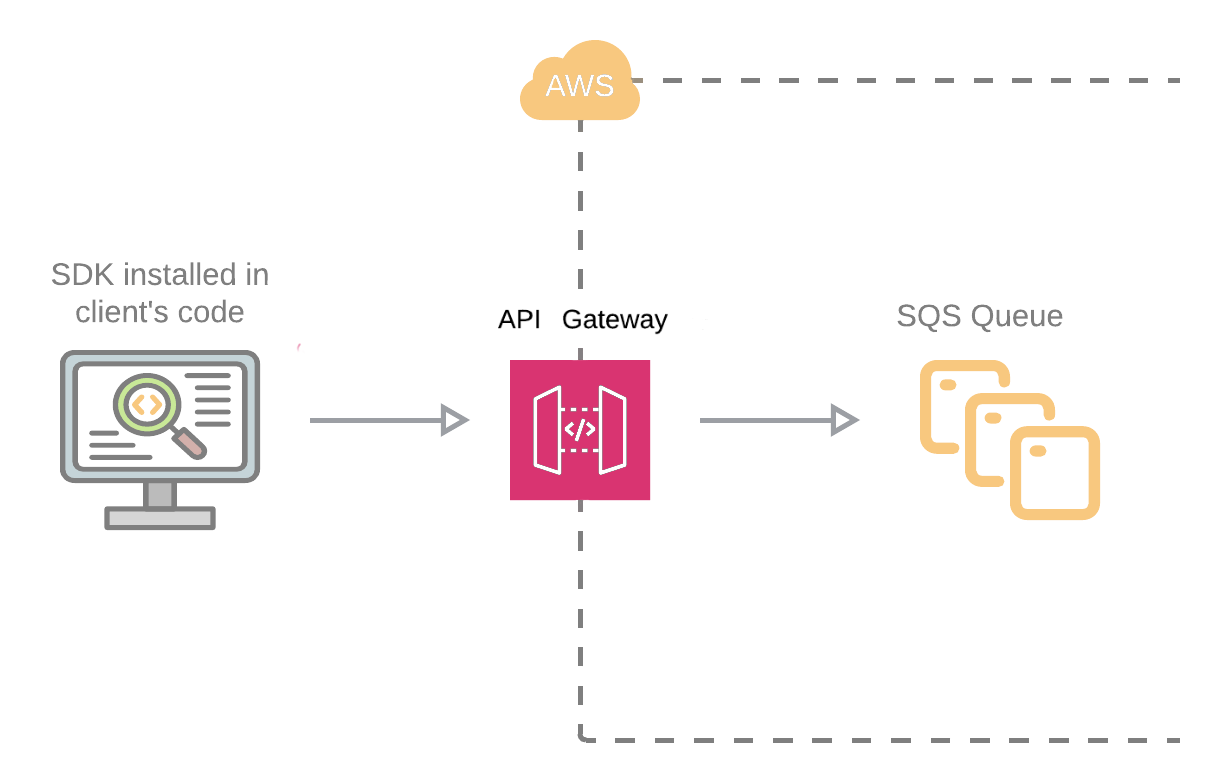
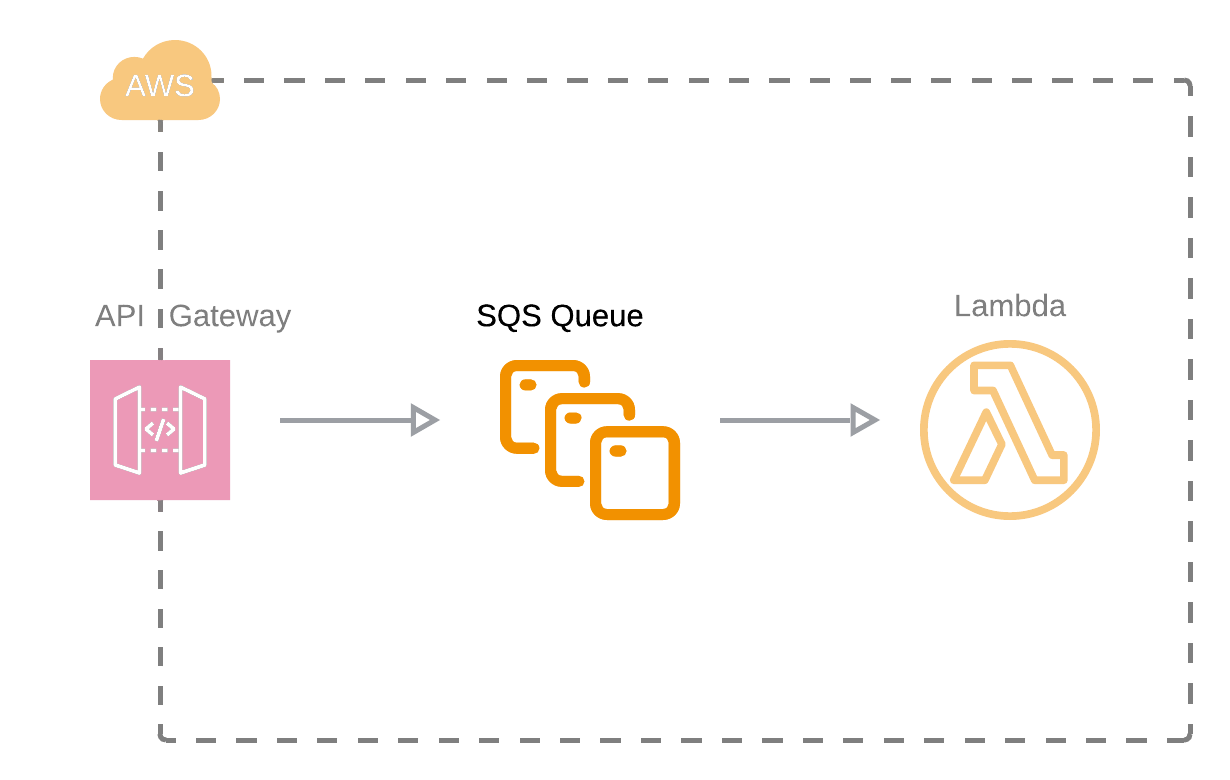
The AWS API Gateway acts as the central entry point to Flytrap’s infrastructure for all incoming error data. The API Gateway is an AWS service that acts as a public-facing API endpoint. It automatically scales based on the volume of incoming requests, ensuring that even during high-traffic periods, the system remains reliable. The Flytrap SDKs transmit error payloads to this gateway, which securely receives and routes requests.
The API Gateway uses API keys and request validations to ensure only a user’s Flytrap SDKs can send error data through the endpoint. After validation, the API Gateway forwards the payloads to an AWS SQS message queue, decoupling ingestion from downstream processing.
Decoupled Processing: SQS for Scalability
AWS Simple Queue Service (SQS) provides a layer of decoupling between data ingestion and processing. Flytrap uses a fully managed message queue to ensure resilience and scalability in high-load scenarios6. The API Gateway ingests error data, while the downstream processing system consumes messages from the queue. The queued data is processed by an AWS Lambda serverless function, which prepares it for storage and further analysis. This setup allows Flytrap’s infrastructure to maintain a smooth and reliable data processing pipeline.
Data Processing: Lambda Function
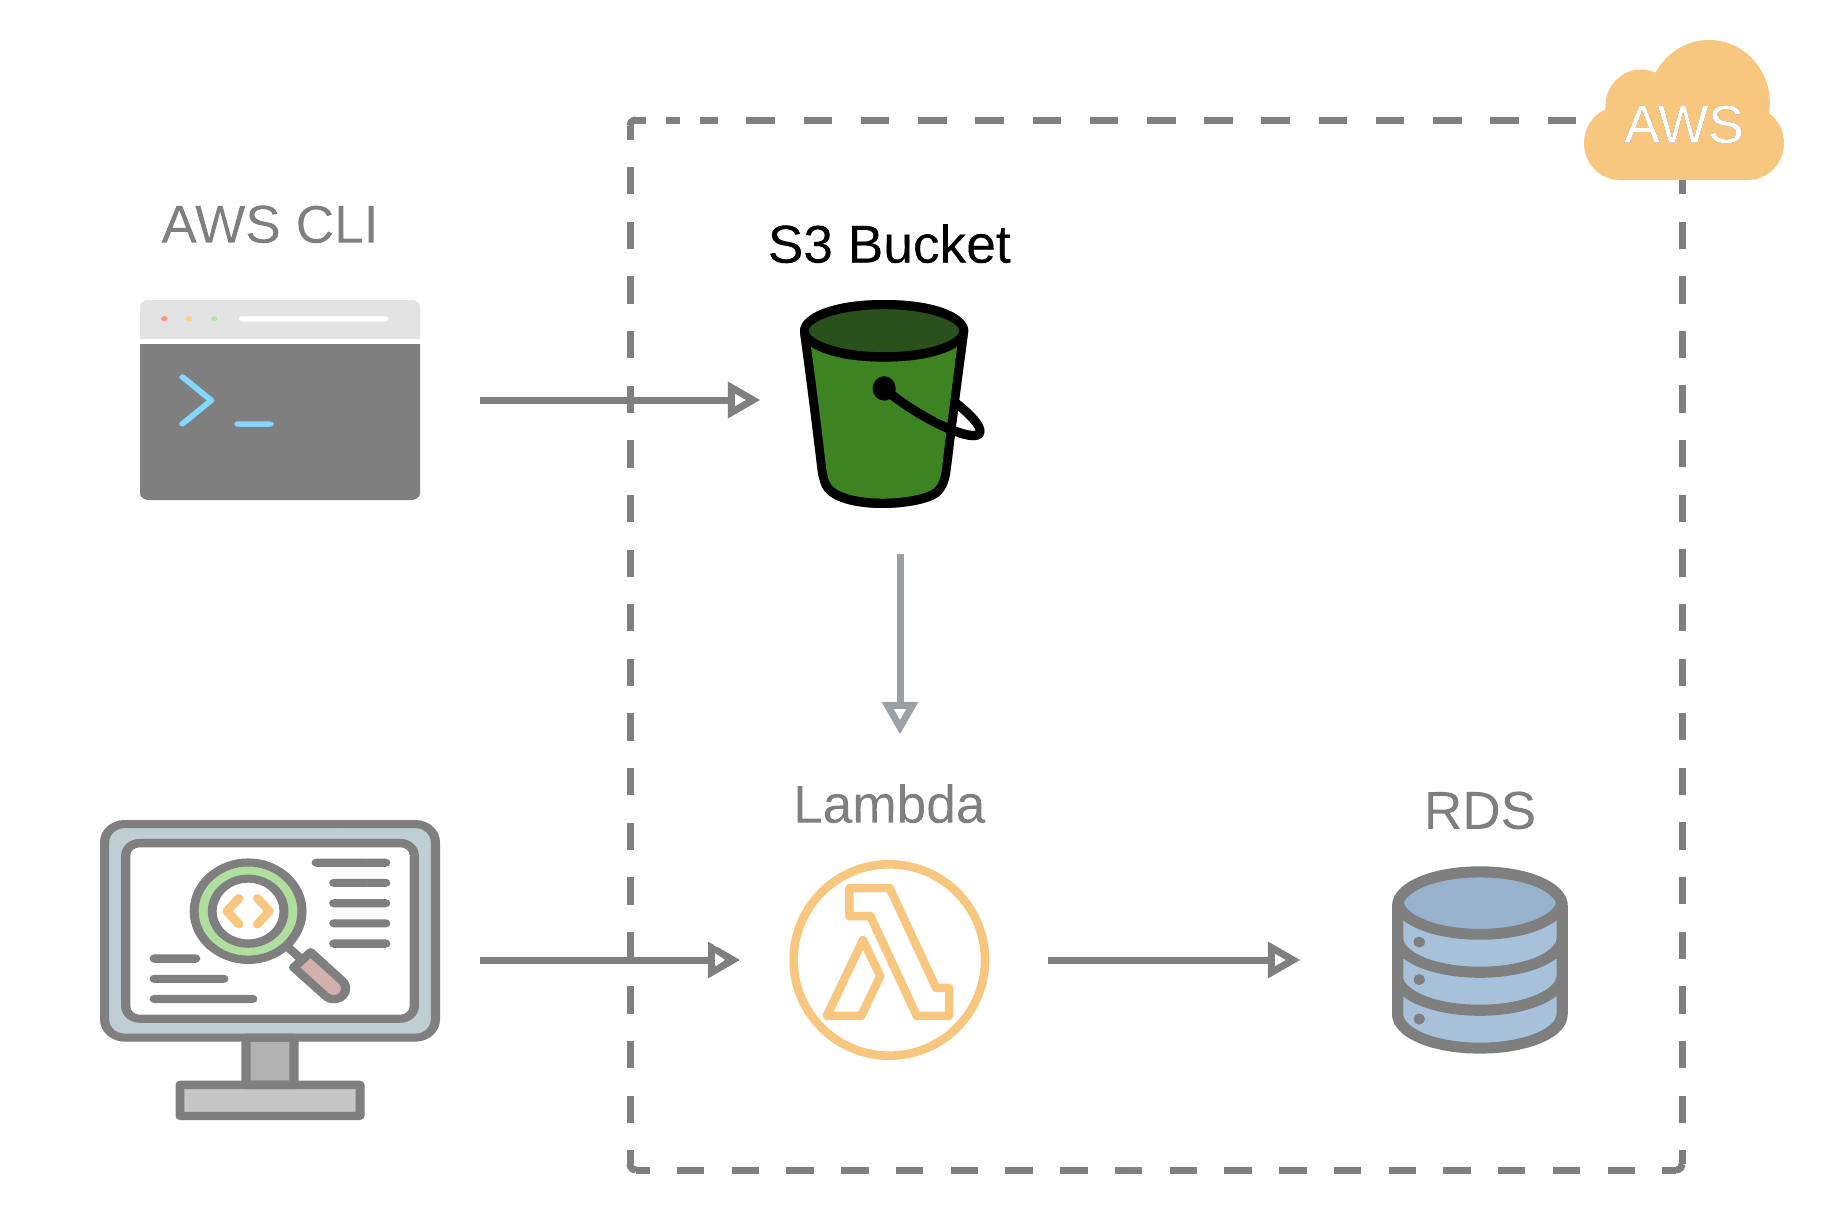
Flytrap uses an AWS Lambda function to process and store error data. Lambda operates in a serverless environment, meaning there’s no need to allocate compute resources ahead of time. The function is automatically triggered whenever new error messages appear in the SQS queue. When the Lambda processes an error message, it performs several key operations:
- Stack Trace Parsing
- Unminification: Resolving minified stack traces by accessing stored source maps and translating minified error locations and code contexts back to their original source files.
- Data Storage: Writing processed error data to a PostgreSQL database.
Lambda’s ability to handle unpredictable, high-traffic loads with automatic scaling made it an appropriate design choice for Flytrap’s error processing pipeline, where load can vary significantly. The choice of Lambda helps ensure that Flytrap’s infrastructure remains both scalable and cost-effective, as users only pay for processing time and avoid the need for manual configuration to accommodate high-load scenarios.

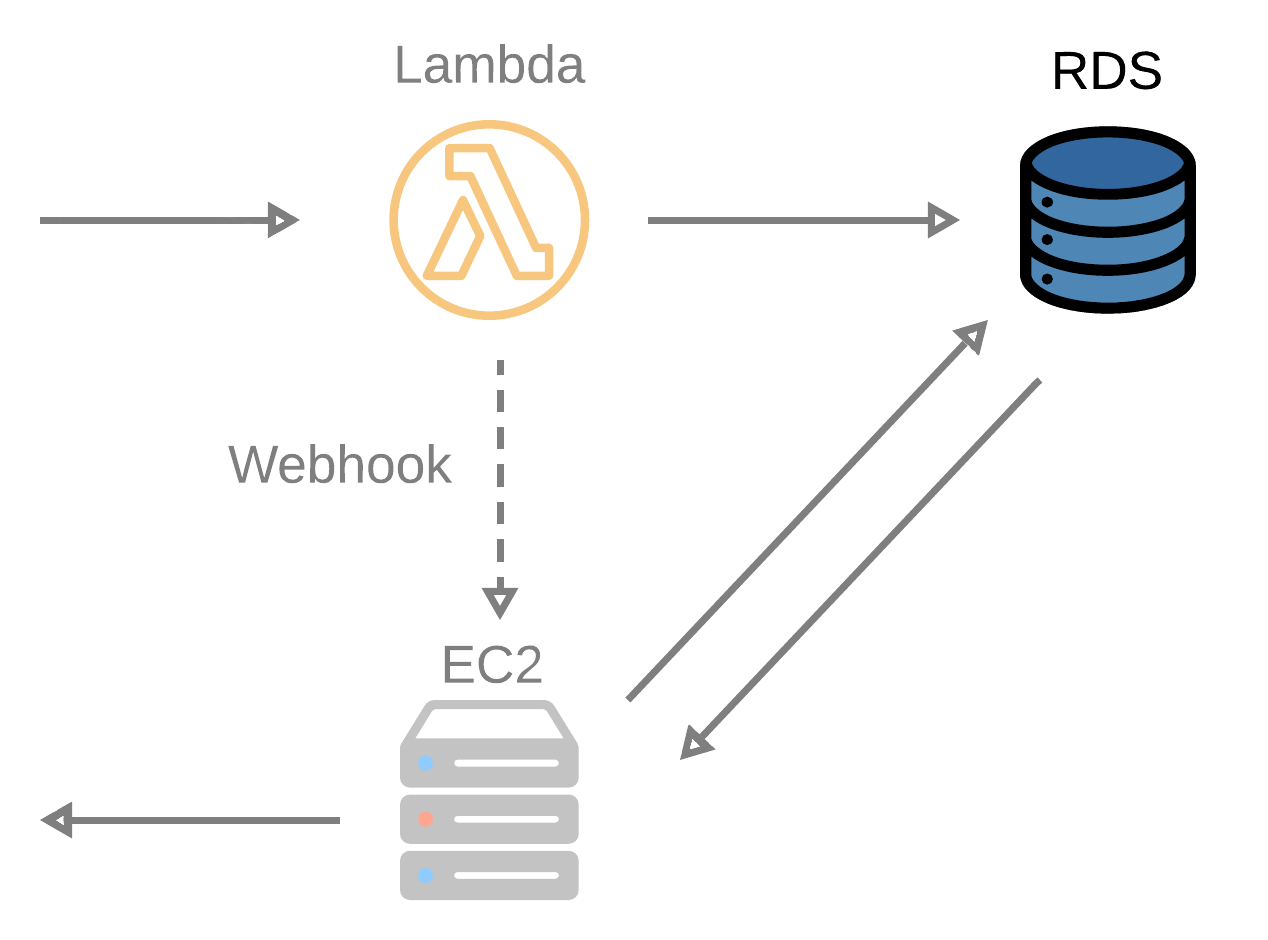
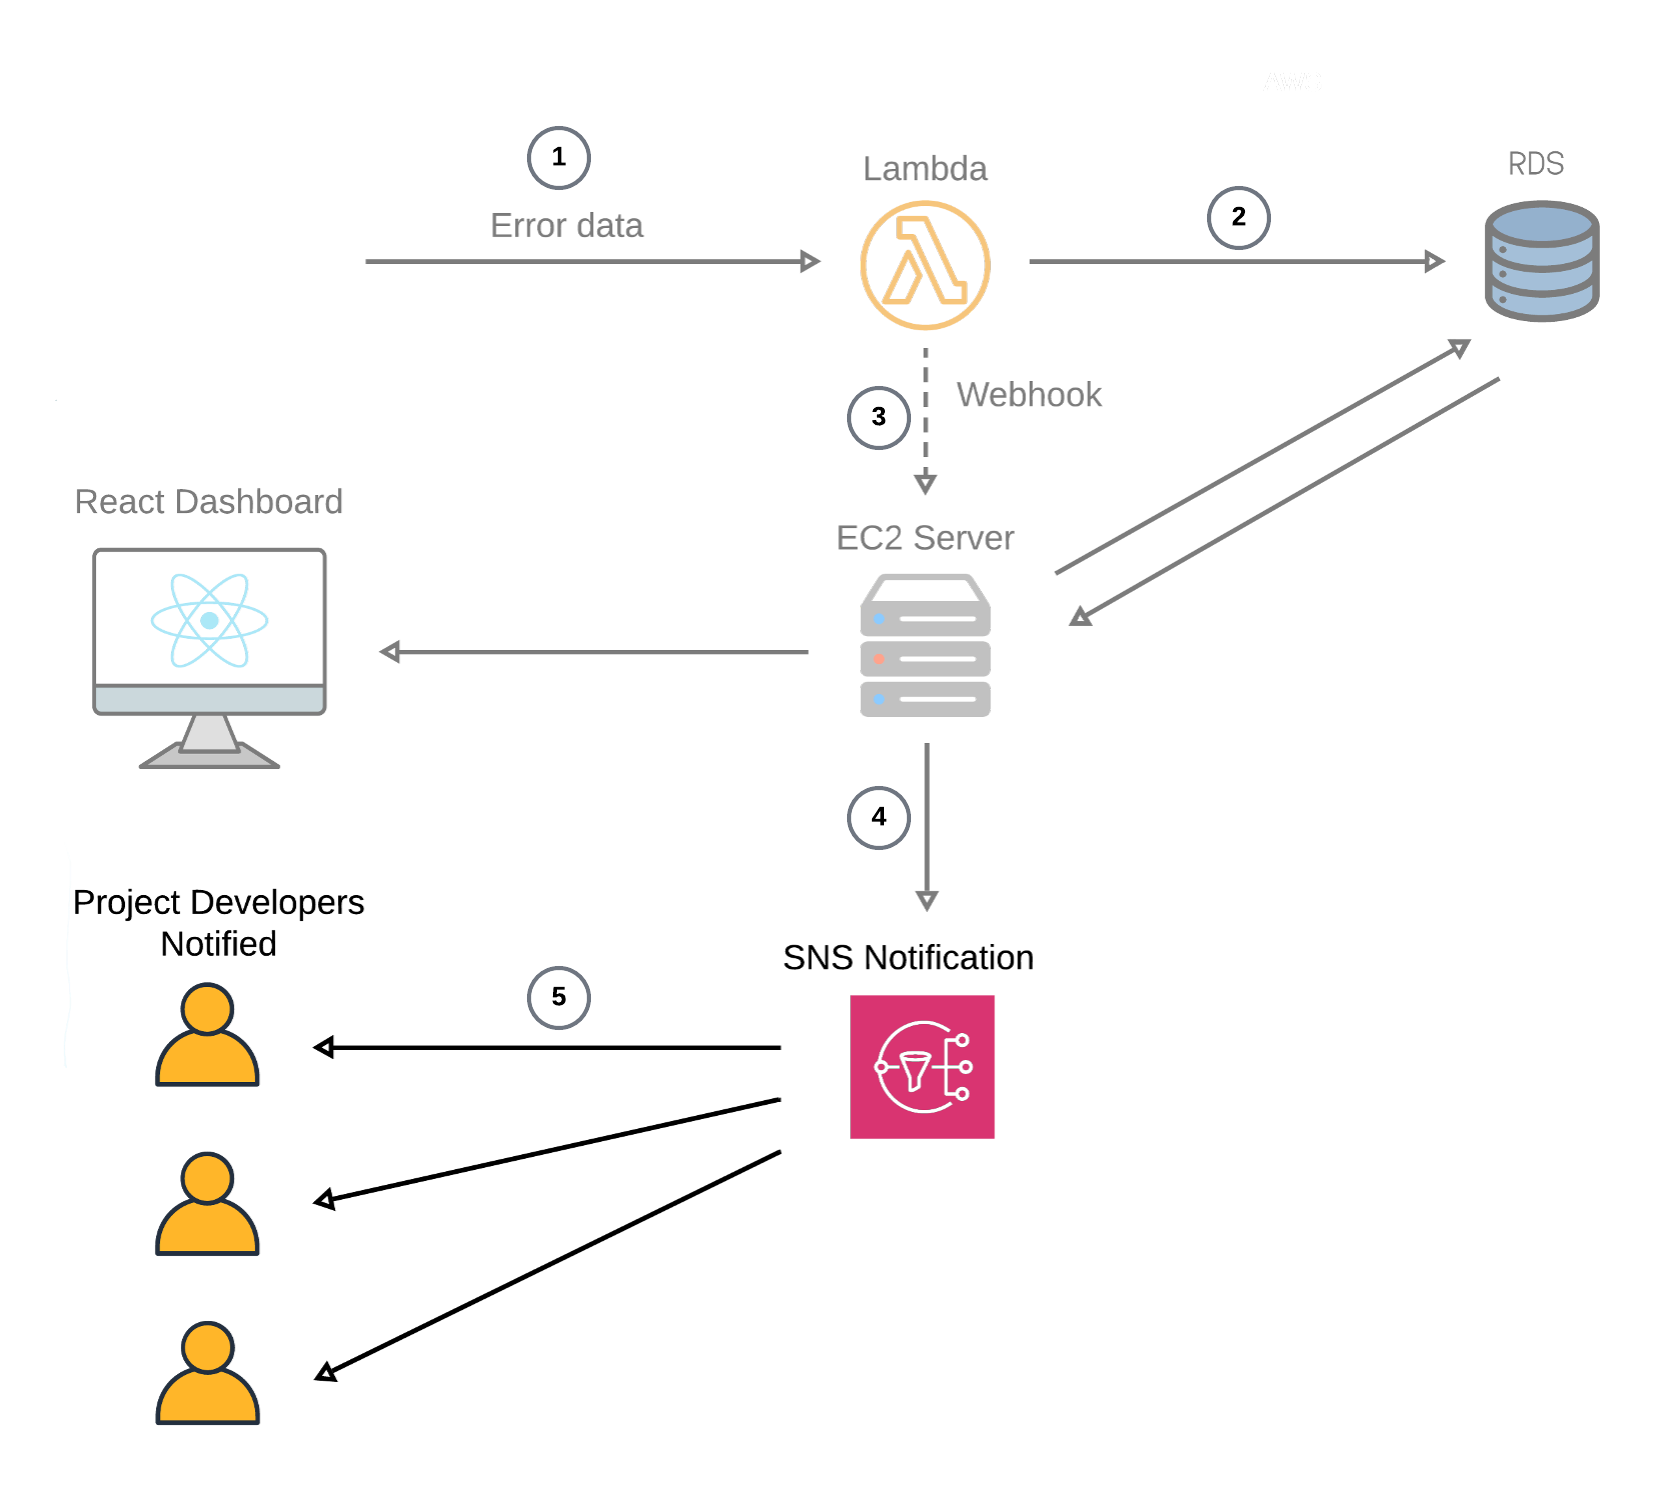
After processing the Lambda writes the error data to an Amazon RDS PostgreSQL database. It then triggers a webhook to notify the Flytrap API of new data availability, enabling near real-time updates on the Flytrap dashboard and email notifications via AWS Simple Notification Service (SNS).
Source Map Upload: Protecting Source Code with S3
For production environments where code is minified, Flytrap provides additional error traceability by supporting optional source map uploads. Users can use the AWS CLI to upload their source maps to an S3 bucket, which is an AWS service for storing and retrieving data in the cloud. The Lambda function references the stored source maps to provide unminified stack trace details and code context, allowing developers to pinpoint the root cause of errors in minified production code.
Persistent Storage: RDS for Structured Data
Processed error data is stored in a PostgreSQL database hosted on AWS Relational Database Service (RDS). This database serves as the central repository for both user-facing and operational data and is used to support Flytrap’s dashboard and analytics functionality.
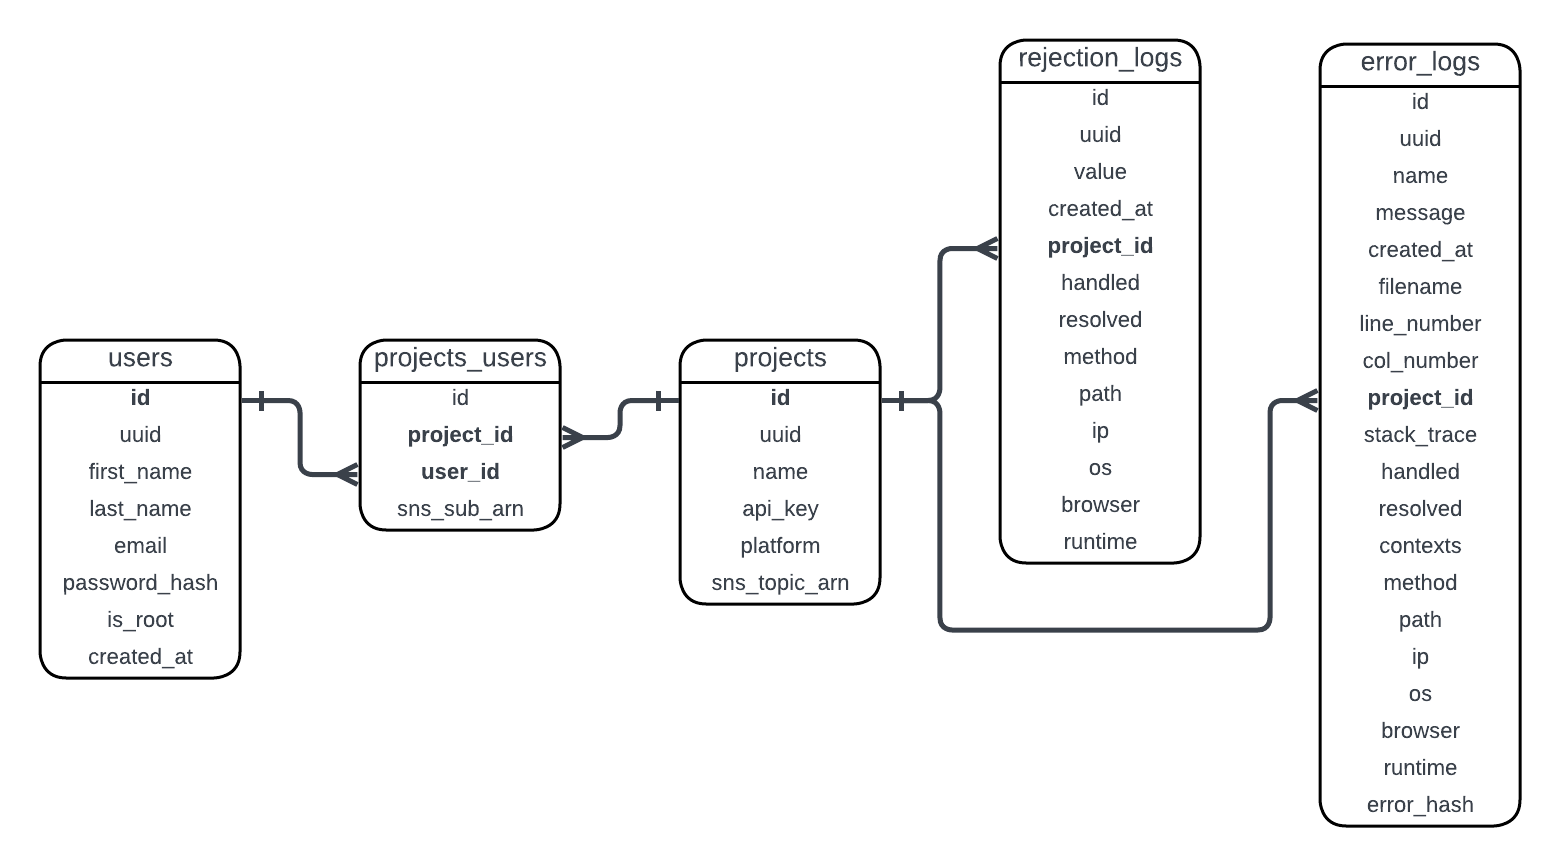
The database schema accommodates Flytrap’s multi-project, multi-user structure. Key tables include:
- Errors: Stores details such as error types, timestamps, stack trace metadata, and associated projects.
- Rejections: Stores details about promise rejections that don’t resolve to an error.
- Projects: Organizes errors by application, allowing users to filter and manage data.
- Users: Manages access control, ensuring developers only see data relevant to their assigned projects.
RDS provides automated backups, failover capabilities, and easy scaling, ensuring high availability and reliability for Flytrap’s users. The stored data is subsequently accessed by the Flytrap dashboard for near real-time updates and user interaction.
Email Alerts: SNS for Developer Notification
Flytrap uses AWS Simple Notification Service (SNS) to alert developers when a new error occurs in a project. For each project, a unique SNS topic is provisioned, and developers assigned to the project are subscribed to the topic. When a new error occurs, the Lambda function processes the error data and writes it to RDS. This action triggers a webhook to the dashboard backend, which then posts a message to the SNS topic, notifying all subscribed developers via email. This alerting system ensures that developers are promptly informed of critical issues, enabling quicker resolution. These notifications work in tandem with the Flytrap dashboard, where developers can investigate and resolve errors.
Full-Stack Application: EC2 for Dashboard and API
Flytrap’s dashboard is powered by a full-stack application hosted on an AWS Elastic Compute Cloud (EC2) instance. This application consists of a Flask backend and a React frontend. The backend is containerized using Docker, with the container stored in Amazon Elastic Container Registry (ECR). An Nginx web server is configured as a reverse proxy to route requests between the frontend and backend services.
The backend provides REST endpoints for filtering and managing error data, ensuring that developers can access and manipulate the error logs. It also supports near real-time updates through WebSocket connections, so developers are instantly notified of new errors as they occur. On the frontend, the React application delivers a user-friendly dashboard for exploring and analyzing error data. Developers can filter, sort, resolve, and delete errors, as well as view error details like stack traces, timestamps, and metadata.
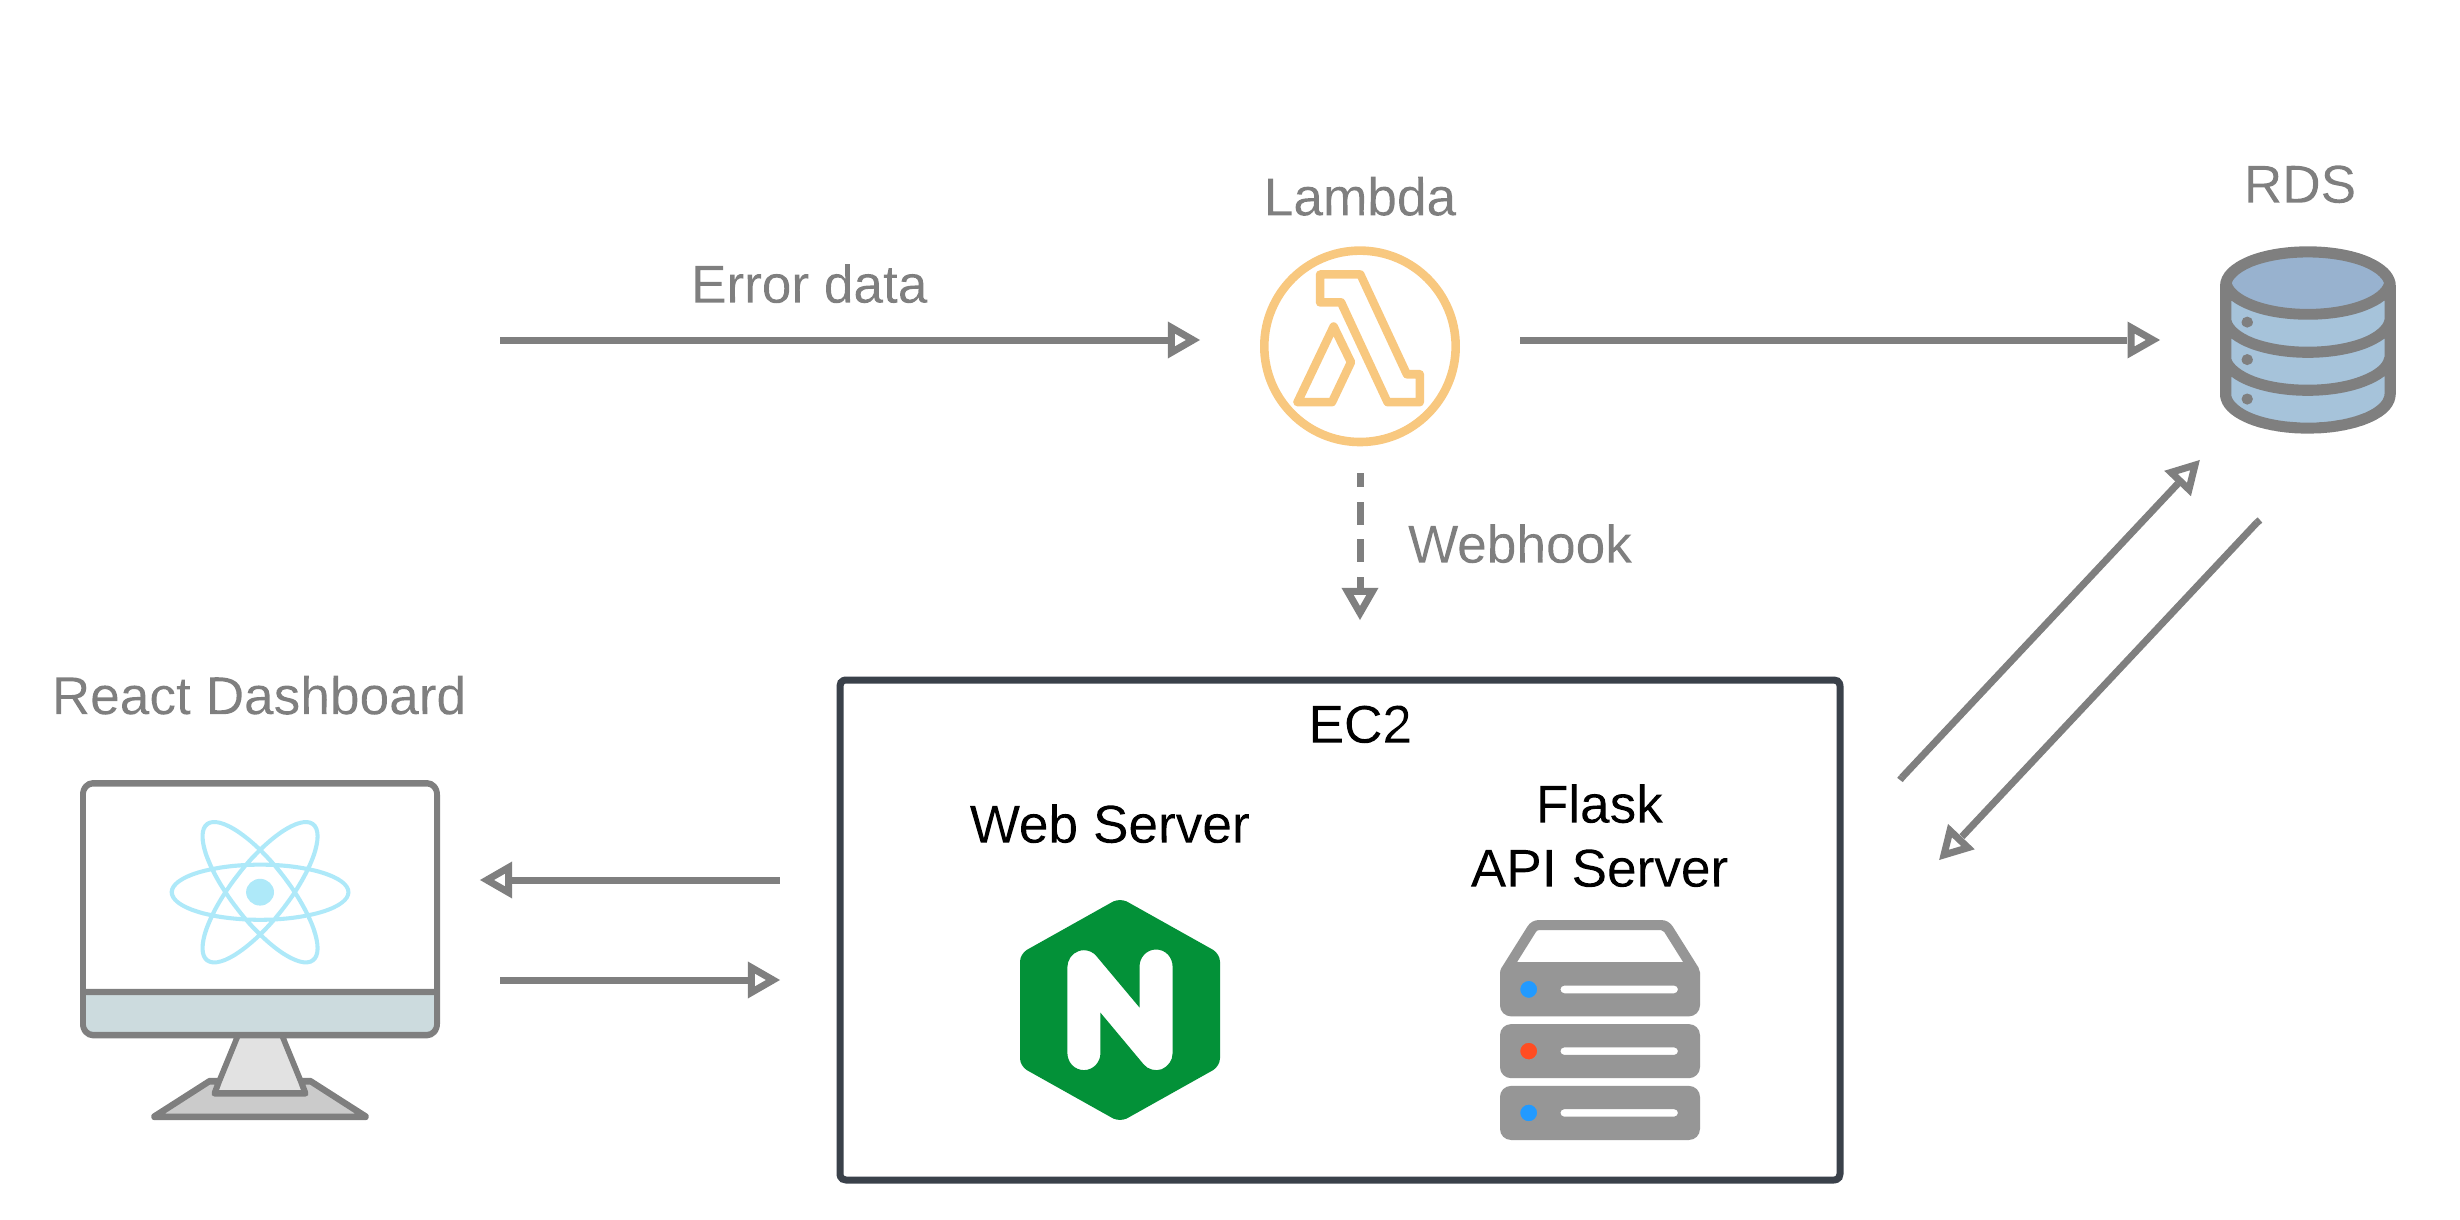
This full-stack system allows developers to efficiently track and manage errors, making it easier to identify issues and implement resolutions.
User-Controlled Architecture: VPC Isolation
Flytrap’s design prioritizes user control and operational independence. The use of a Virtual Private Cloud (VPC) adds an additional layer of isolation and security. Isolating resources into a dedicated VPC prevents potential conflicts with other services or configurations already running in the user’s default AWS VPC.
The Big Picture: Data Flow and AWS Architecture
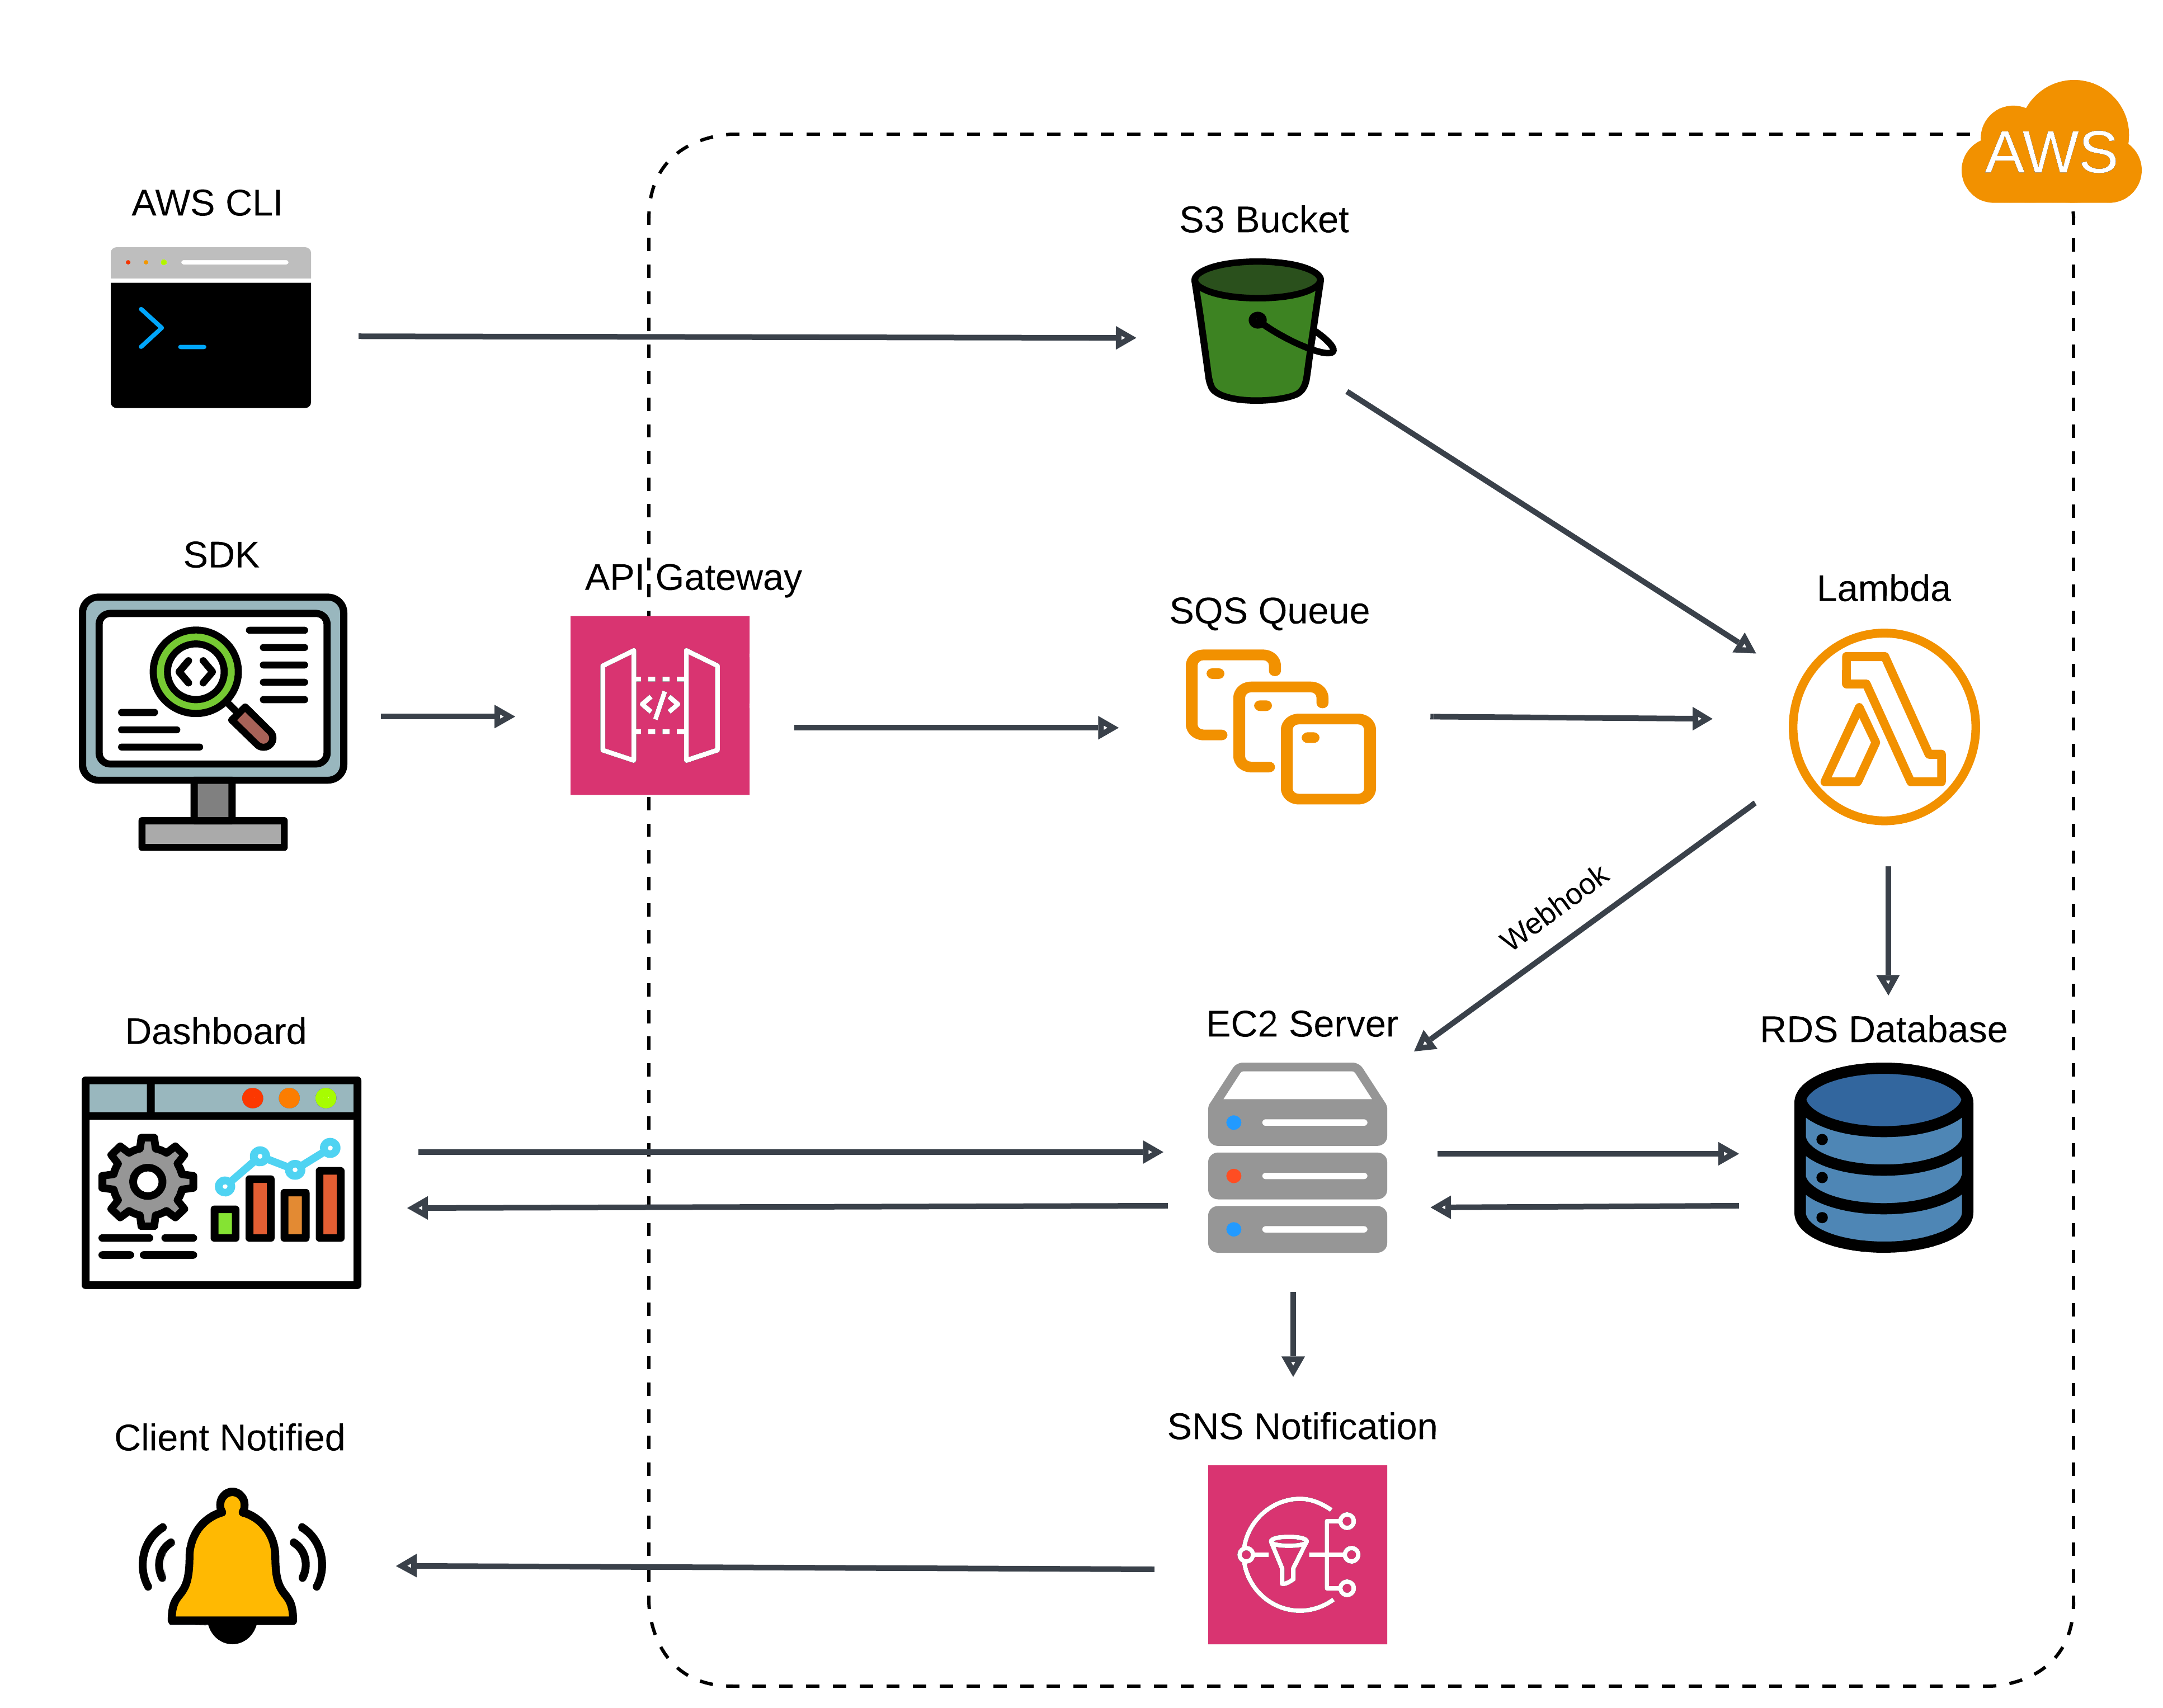
Flytrap's architecture efficiently ingests, transfers, stores, and displays error data using AWS services for automated data processing.
- SDKs: Capture and standardize error data.
- API Gateway: Validates and routes incoming payloads.
- SQS: Queues messages for decoupled processing.
- Lambda: Processes data using S3 source maps and stores it in RDS.
- RDS: Serves as the central database for structured error data.
- SNS: Sends email notifications to developers for critical errors.
- Dashboard: Enables developers to investigate and resolve errors.
The system ensures efficient error monitoring and reporting, offering developers detailed insights and maintaining secure, scalable infrastructure for reliable performance.
Engineering Challenges
This section examines some of the key engineering challenges encountered during Flytrap’s development.
High Load Handling and System Segmentation
Problem: Differing Load Between Error Processor and Dashboard
One of the key architectural decisions made in Flytrap was to separate the error processing pipeline from the full-stack application. This was necessary to handle the vastly different loads between the two systems, especially in high-load scenarios where error processing can overwhelm infrastructure. For example, in cases where an infinite loop or a flood of errors from an application causes a spike in error logs, Flytrap’s error processing system must be equipped to handle this spike without affecting the performance of the dashboard application.
Solution: Separate Architectural Branches via AWS Services
Flytrap addresses this challenge by creating a clear separation between the error processing pipeline and the full-stack application. The error processing system consists of multiple components: API Gateway, SQS queue, and Lambda function. This system is designed to manage high-volume incoming error data. In the event of a traffic spike—such as an infinite loop generating massive amounts of logs—Flytrap utilizes an SQS message queue to buffer and throttle error messages. This helps prevent an overwhelming influx of data from disrupting the rest of the system. The SQS queue ensures that even in high-load situations, error data is processed efficiently, without causing system downtime or poor performance.

Meanwhile, the fullstack application, which is used primarily by a single development team, is intentionally designed to have a much lower and more predictable load. This separation allows the two systems to scale independently. Any issues within the error processing pipeline—like traffic spikes or bottlenecks—do not directly impact the main application, which is essential for maintaining an uninterrupted developer workflow.
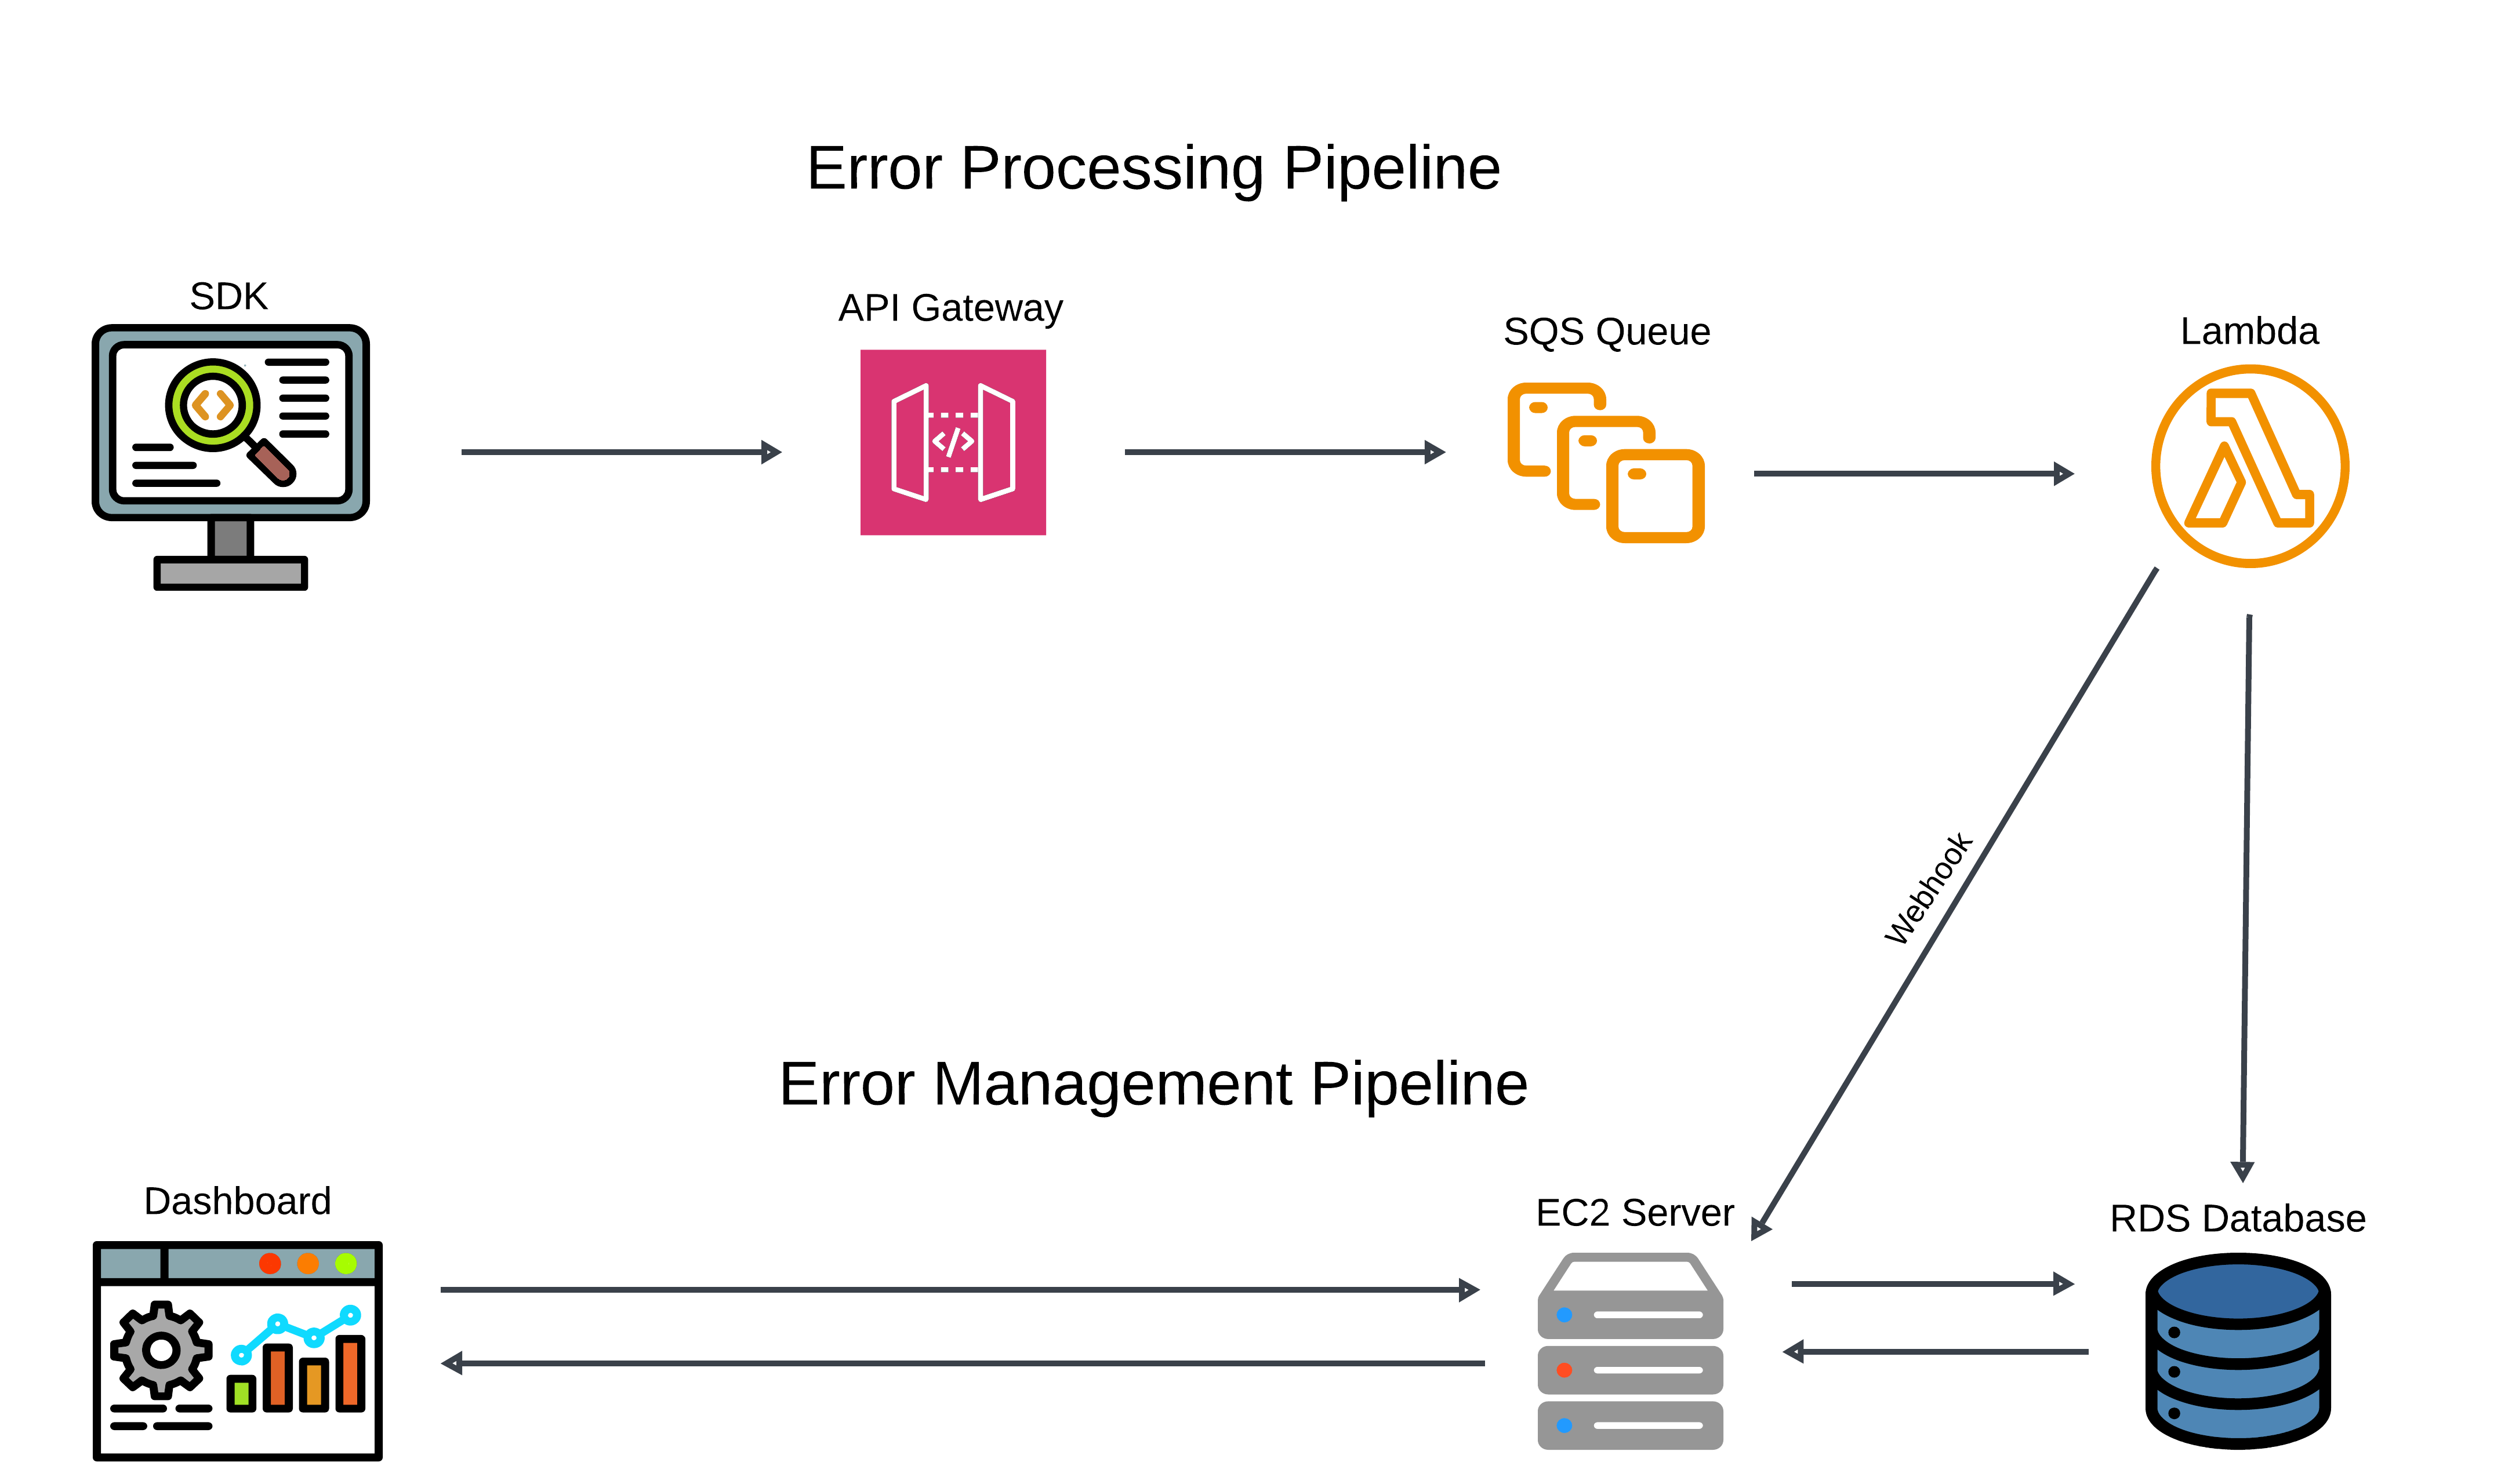
By partitioning these workloads, Flytrap provides a scalable solution for handling error data, ensuring that both the error processing infrastructure and the main application remain stable and performant.
Data Ownership and Minified Code
Problem: Source Map Privacy and Traceable Errors
In production environments, JavaScript code is often minified to reduce file size and improve performance. While this optimization benefits end users, it complicates debugging by making stack traces difficult to interpret. Developers need a way to translate these minified stack traces back into the original source code for effective debugging. Source maps7 are the standard way to achieve this, but handling them comes with a challenge: ensuring privacy and security while still offering accurate and actionable error traceability.
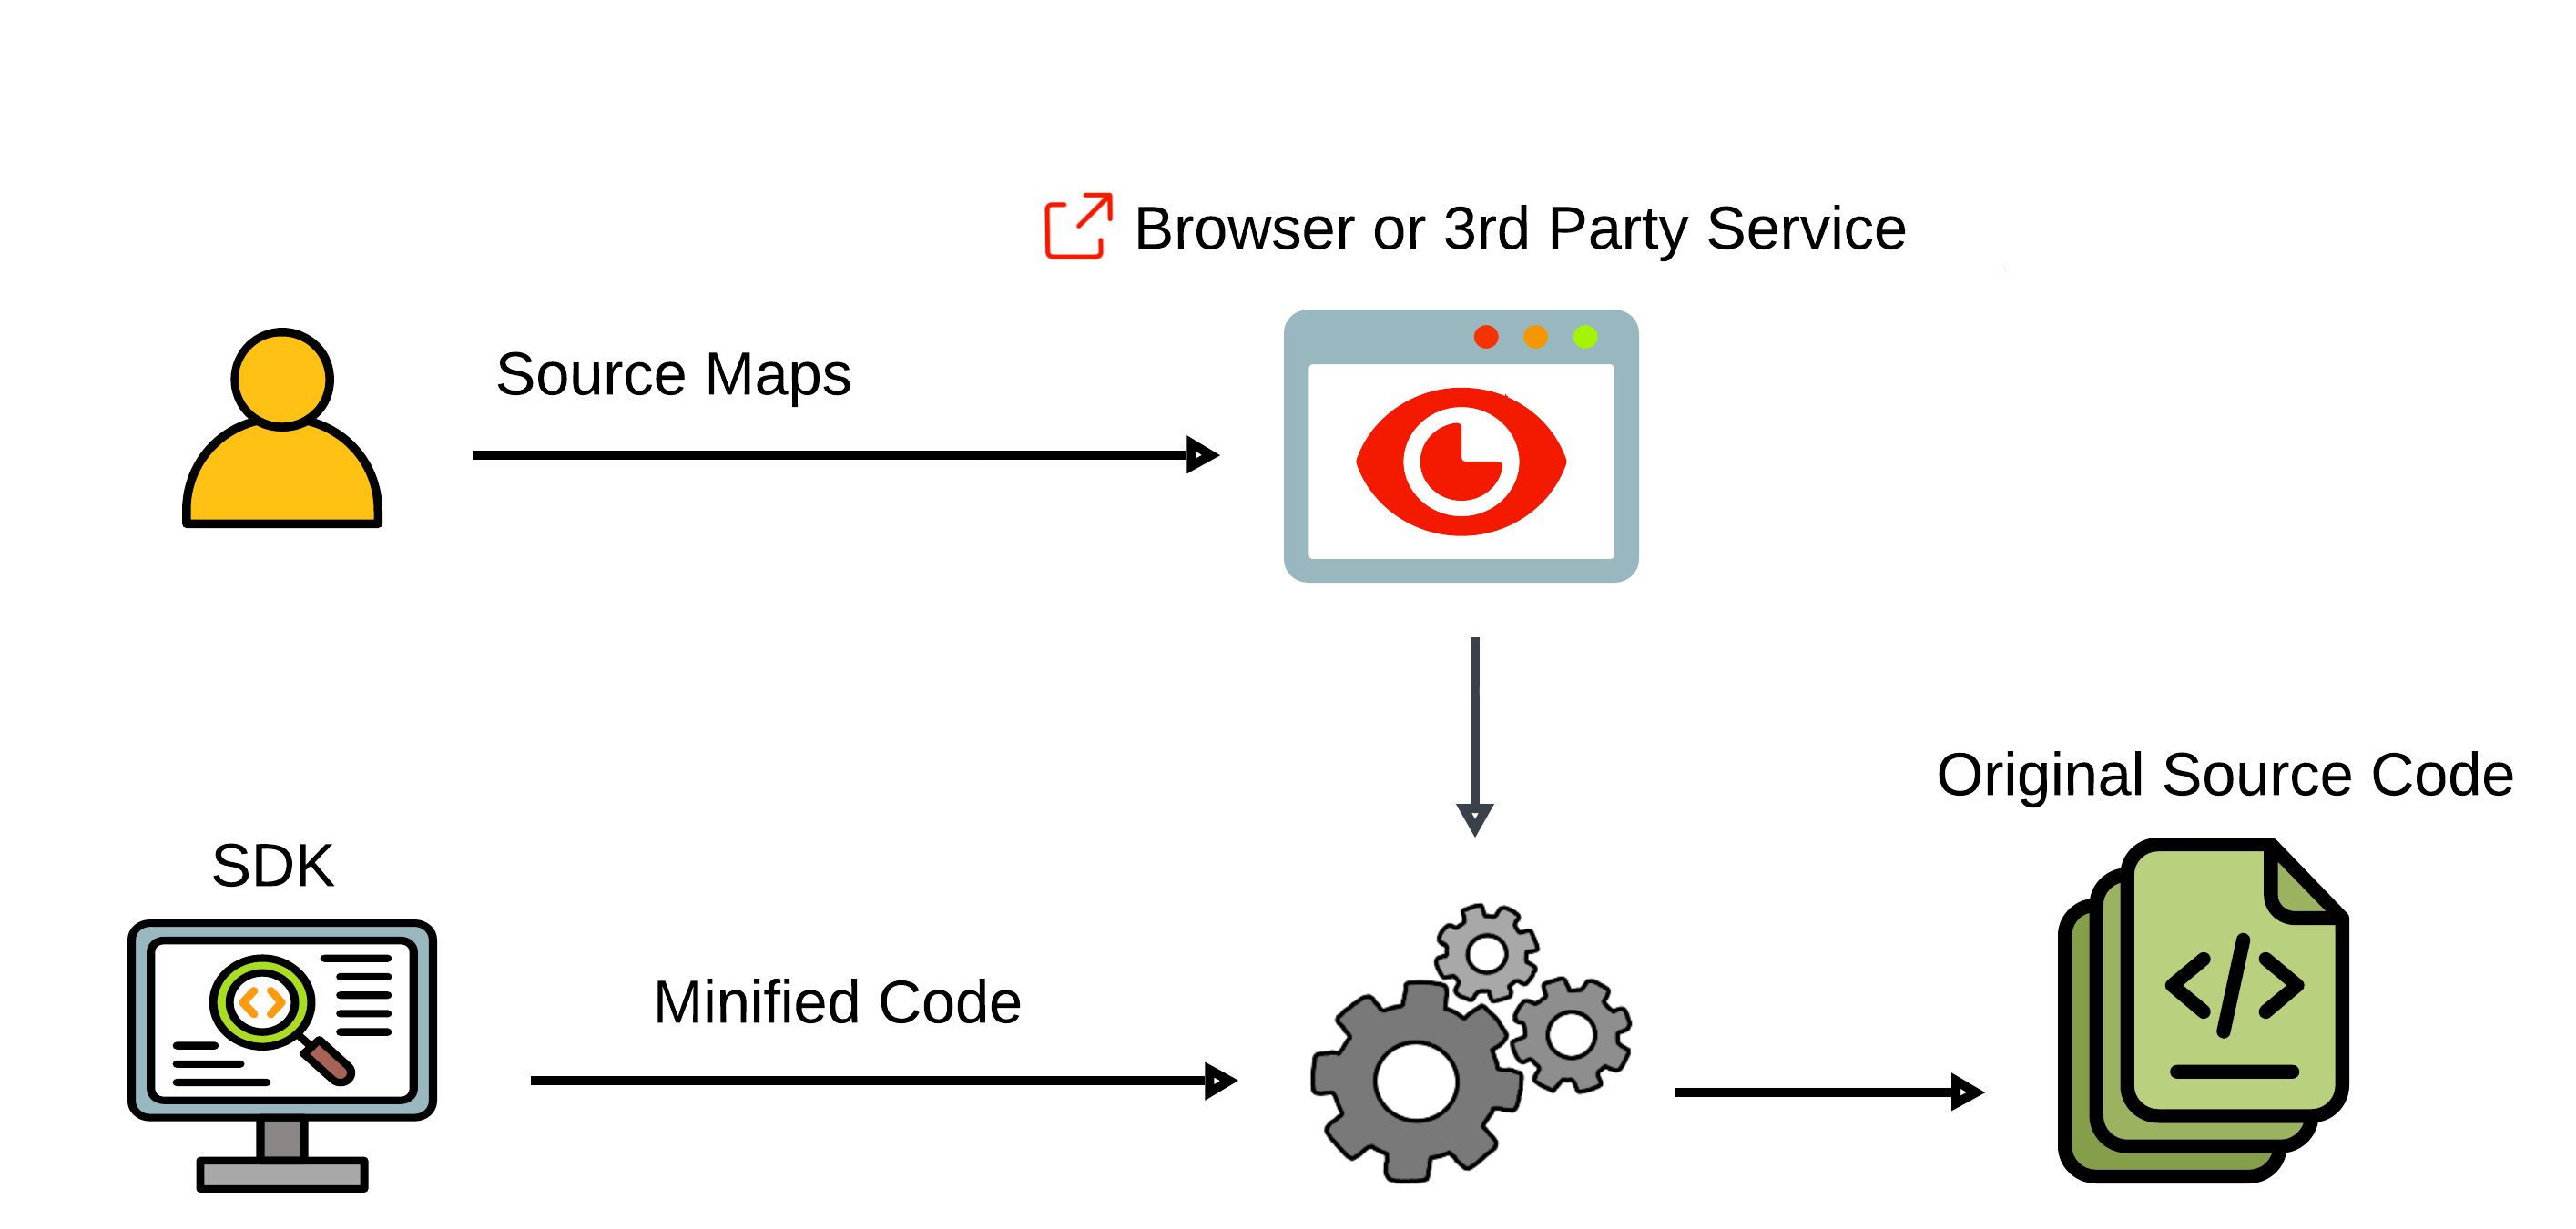
Solution: Secure Source Map Handling with AWS S3 Integration
Flytrap provides support for source map uploads, enabling the translation of minified code back to the original source code. To tackle the privacy concerns associated with source maps, Flytrap takes a privacy-first approach. Instead of requiring users to make their source maps publicly accessible or upload them to third-party services, Flytrap allows users to upload inline source maps to their own AWS S3 bucket. This guarantees that only the user can access and reconstruct the original source code.
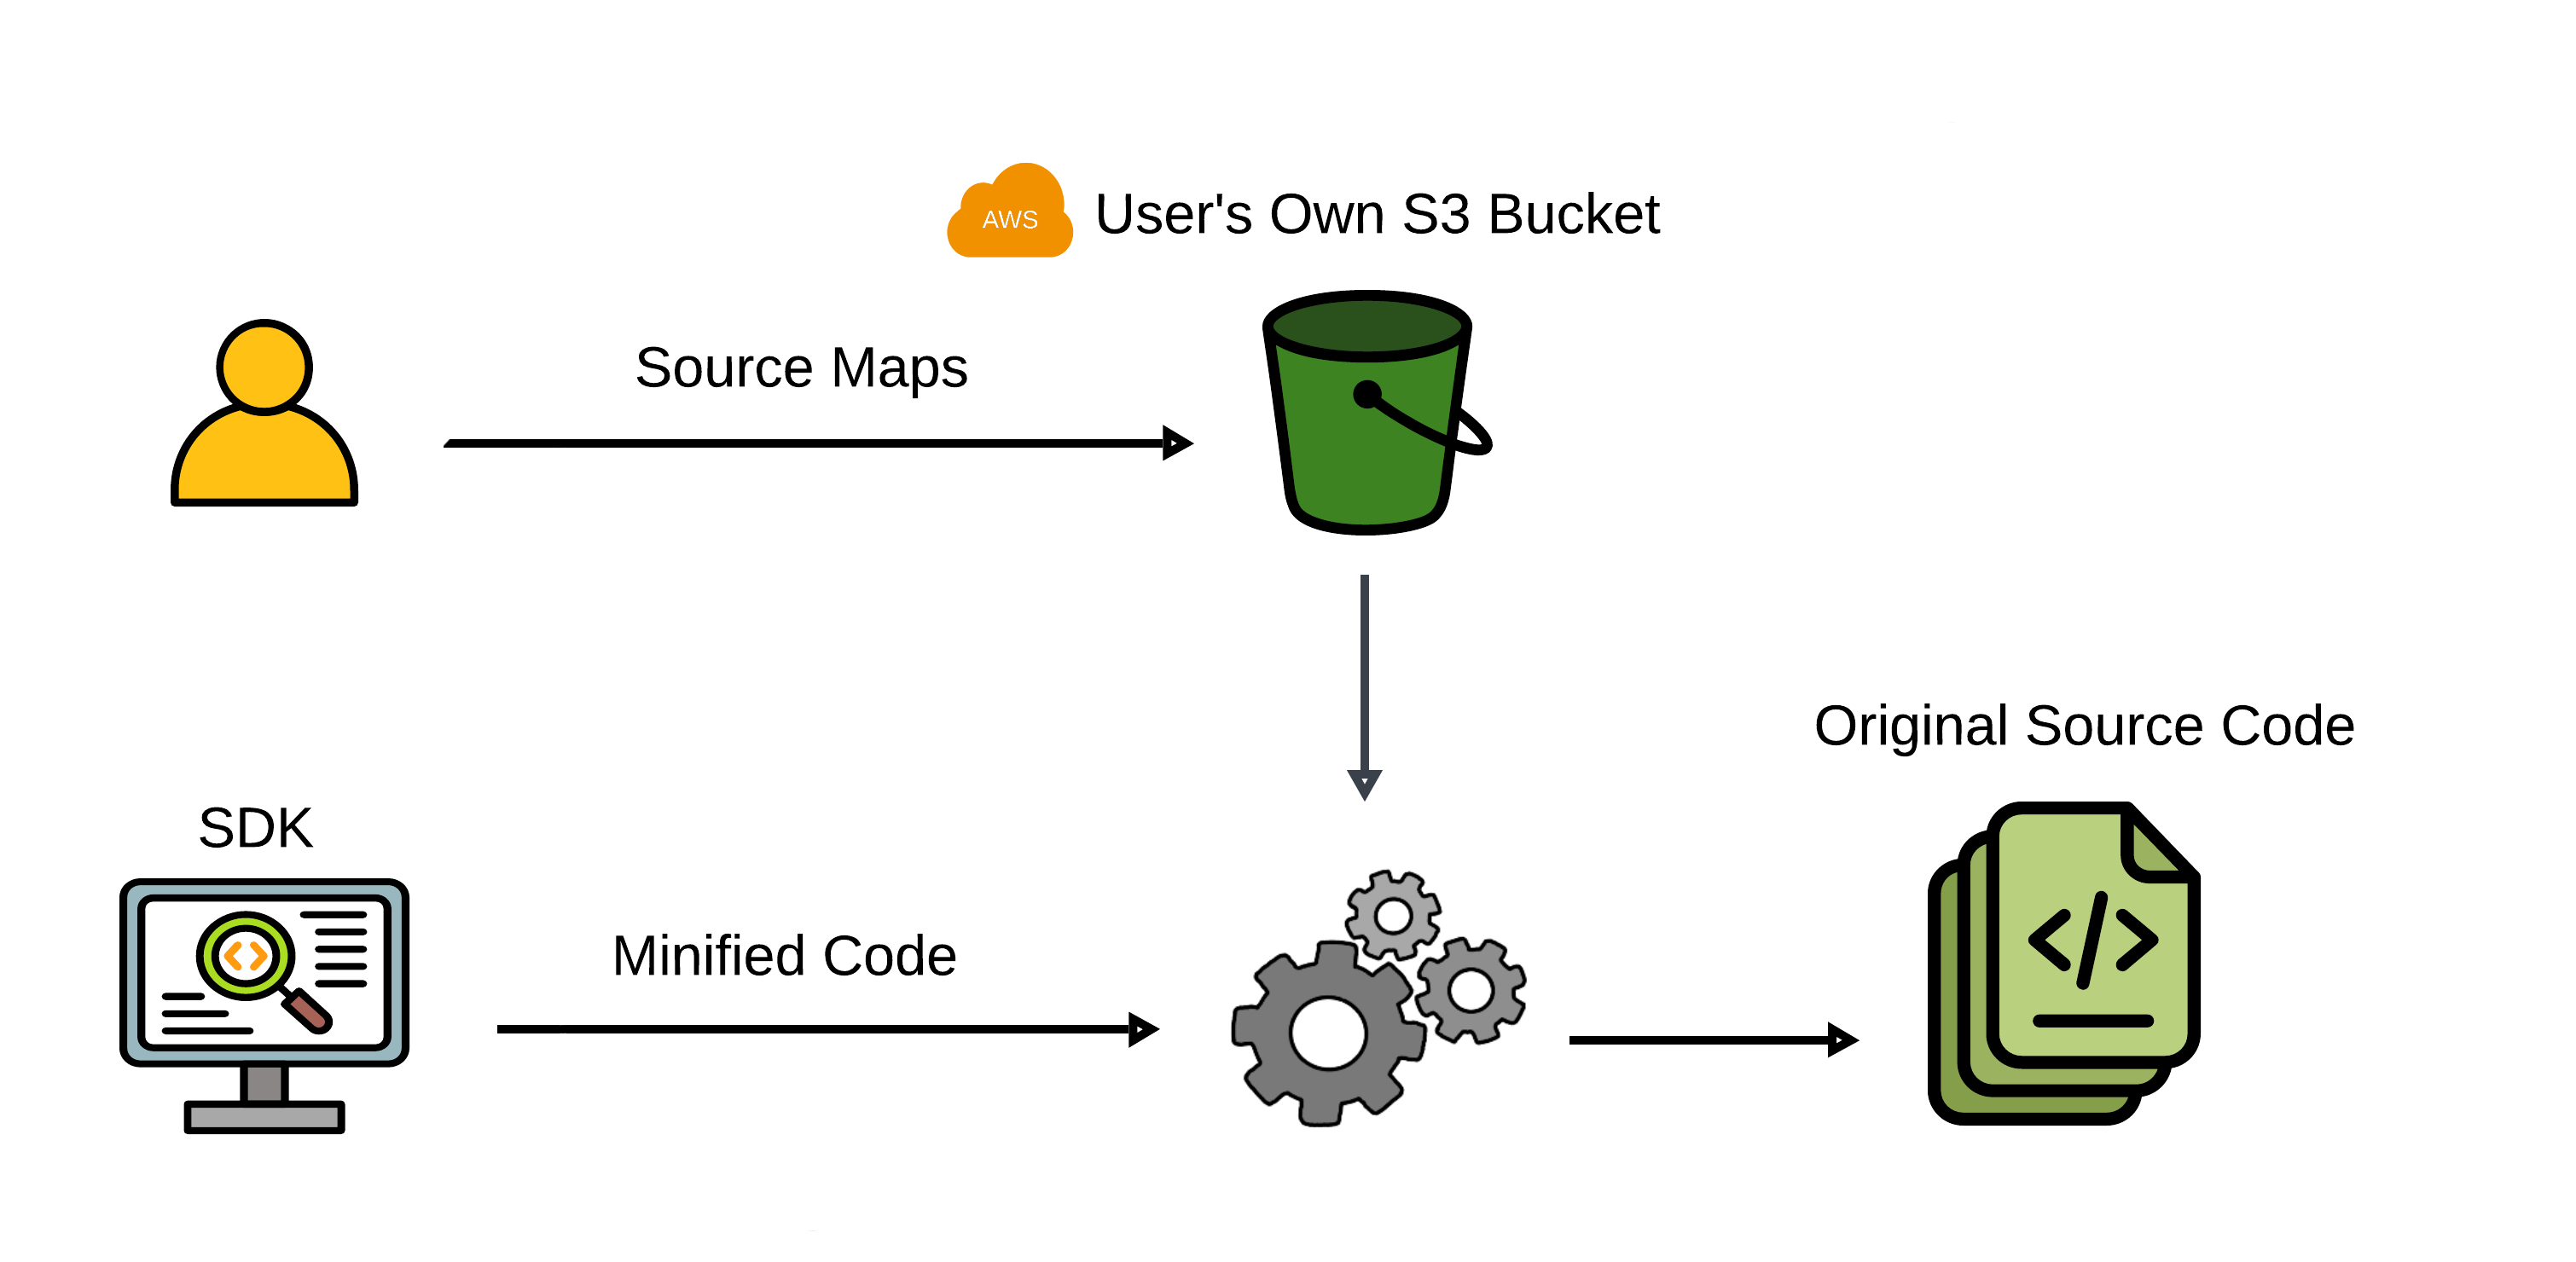
Flytrap’s Lambda function plays a critical role in this integration. It inspects incoming stack traces for the presence of .min in the filenames, which typically indicates minified code. If a stack trace indicates minified code, Flytrap looks for the corresponding source map in the user’s S3 bucket. If a source map is found, Flytrap uses it to generate an unminified stack trace and contextual information for the developer. If no source map is found, Flytrap defaults to using the minified data to ensure performance is not compromised.
This approach ensures that even errors in minified JavaScript can be accurately mapped back to the original source code when a source map is available, significantly improving the debugging experience.
WebSockets and SNS: Enhancing Communication
Problem: Delayed Detection of Errors Without Monitoring Systems
Without an error monitoring system, errors can go undetected for extended periods or may never be detected. Developers typically rely on unclear user reports indicating issues, followed by manually sifting through logs to identify and resolve the problem. This process is time-consuming and inefficient, leading to potential downtime and frustrated users.
Solution: Centralized, Near Real-Time Error Alerts
Flytrap solves this problem by providing centralized error data and delivering near real-time alerts through two channels.
- Email Alerts via SNS Flytrap integrates with AWS Simple Notification Service (SNS) to send email alerts whenever an error is logged within a project. Each project has a dedicated SNS topic, ensuring that only developers subscribed to that topic receive notifications. This guarantees that critical errors are promptly brought to developers' attention, even if they are not actively using the Flytrap dashboard, reducing the risk of missed issues.
- WebSocket Pop-Ups for Active Developers For developers actively working within the Flytrap dashboard, WebSockets provide near real-time pop-up notifications about new errors. This allows developers to address issues immediately without needing to refresh or sift through logs, providing instant visibility into new problems and ensuring rapid response times.
The primary challenge Flytrap addresses is ensuring developers reƒceive timely error notifications across both passive (email) and active (WebSocket) channels. This system ensures developers are alerted to issues immediately, no matter how they are interacting with the platform.
Flask-Specific Design Choice: SSE vs. WebSockets
While Server-Sent Events (SSE) were initially considered for near real-time notifications, WebSockets were ultimately chosen due to their scalability and efficiency within a Flask-based setup. SSE relies on long-lived HTTP connections8, which can cause performance bottlenecks and reliability issues within Flask’s synchronous Web Server Gateway Interface (WSGI) model9. WSGI is a standard interface between web servers and Python web applications that handles requests in a synchronous manner. In contrast, WebSockets operate over a single, persistent TCP connection10, thereby bypassing the limitations of HTTP and Flask’s synchronous architecture, and allowing Flytrap to handle notifications with reduced latency and more efficient communication. This Flask-specific design choice ensures scalability and better overall performance, while also providing enhanced security through header-based token transmission.
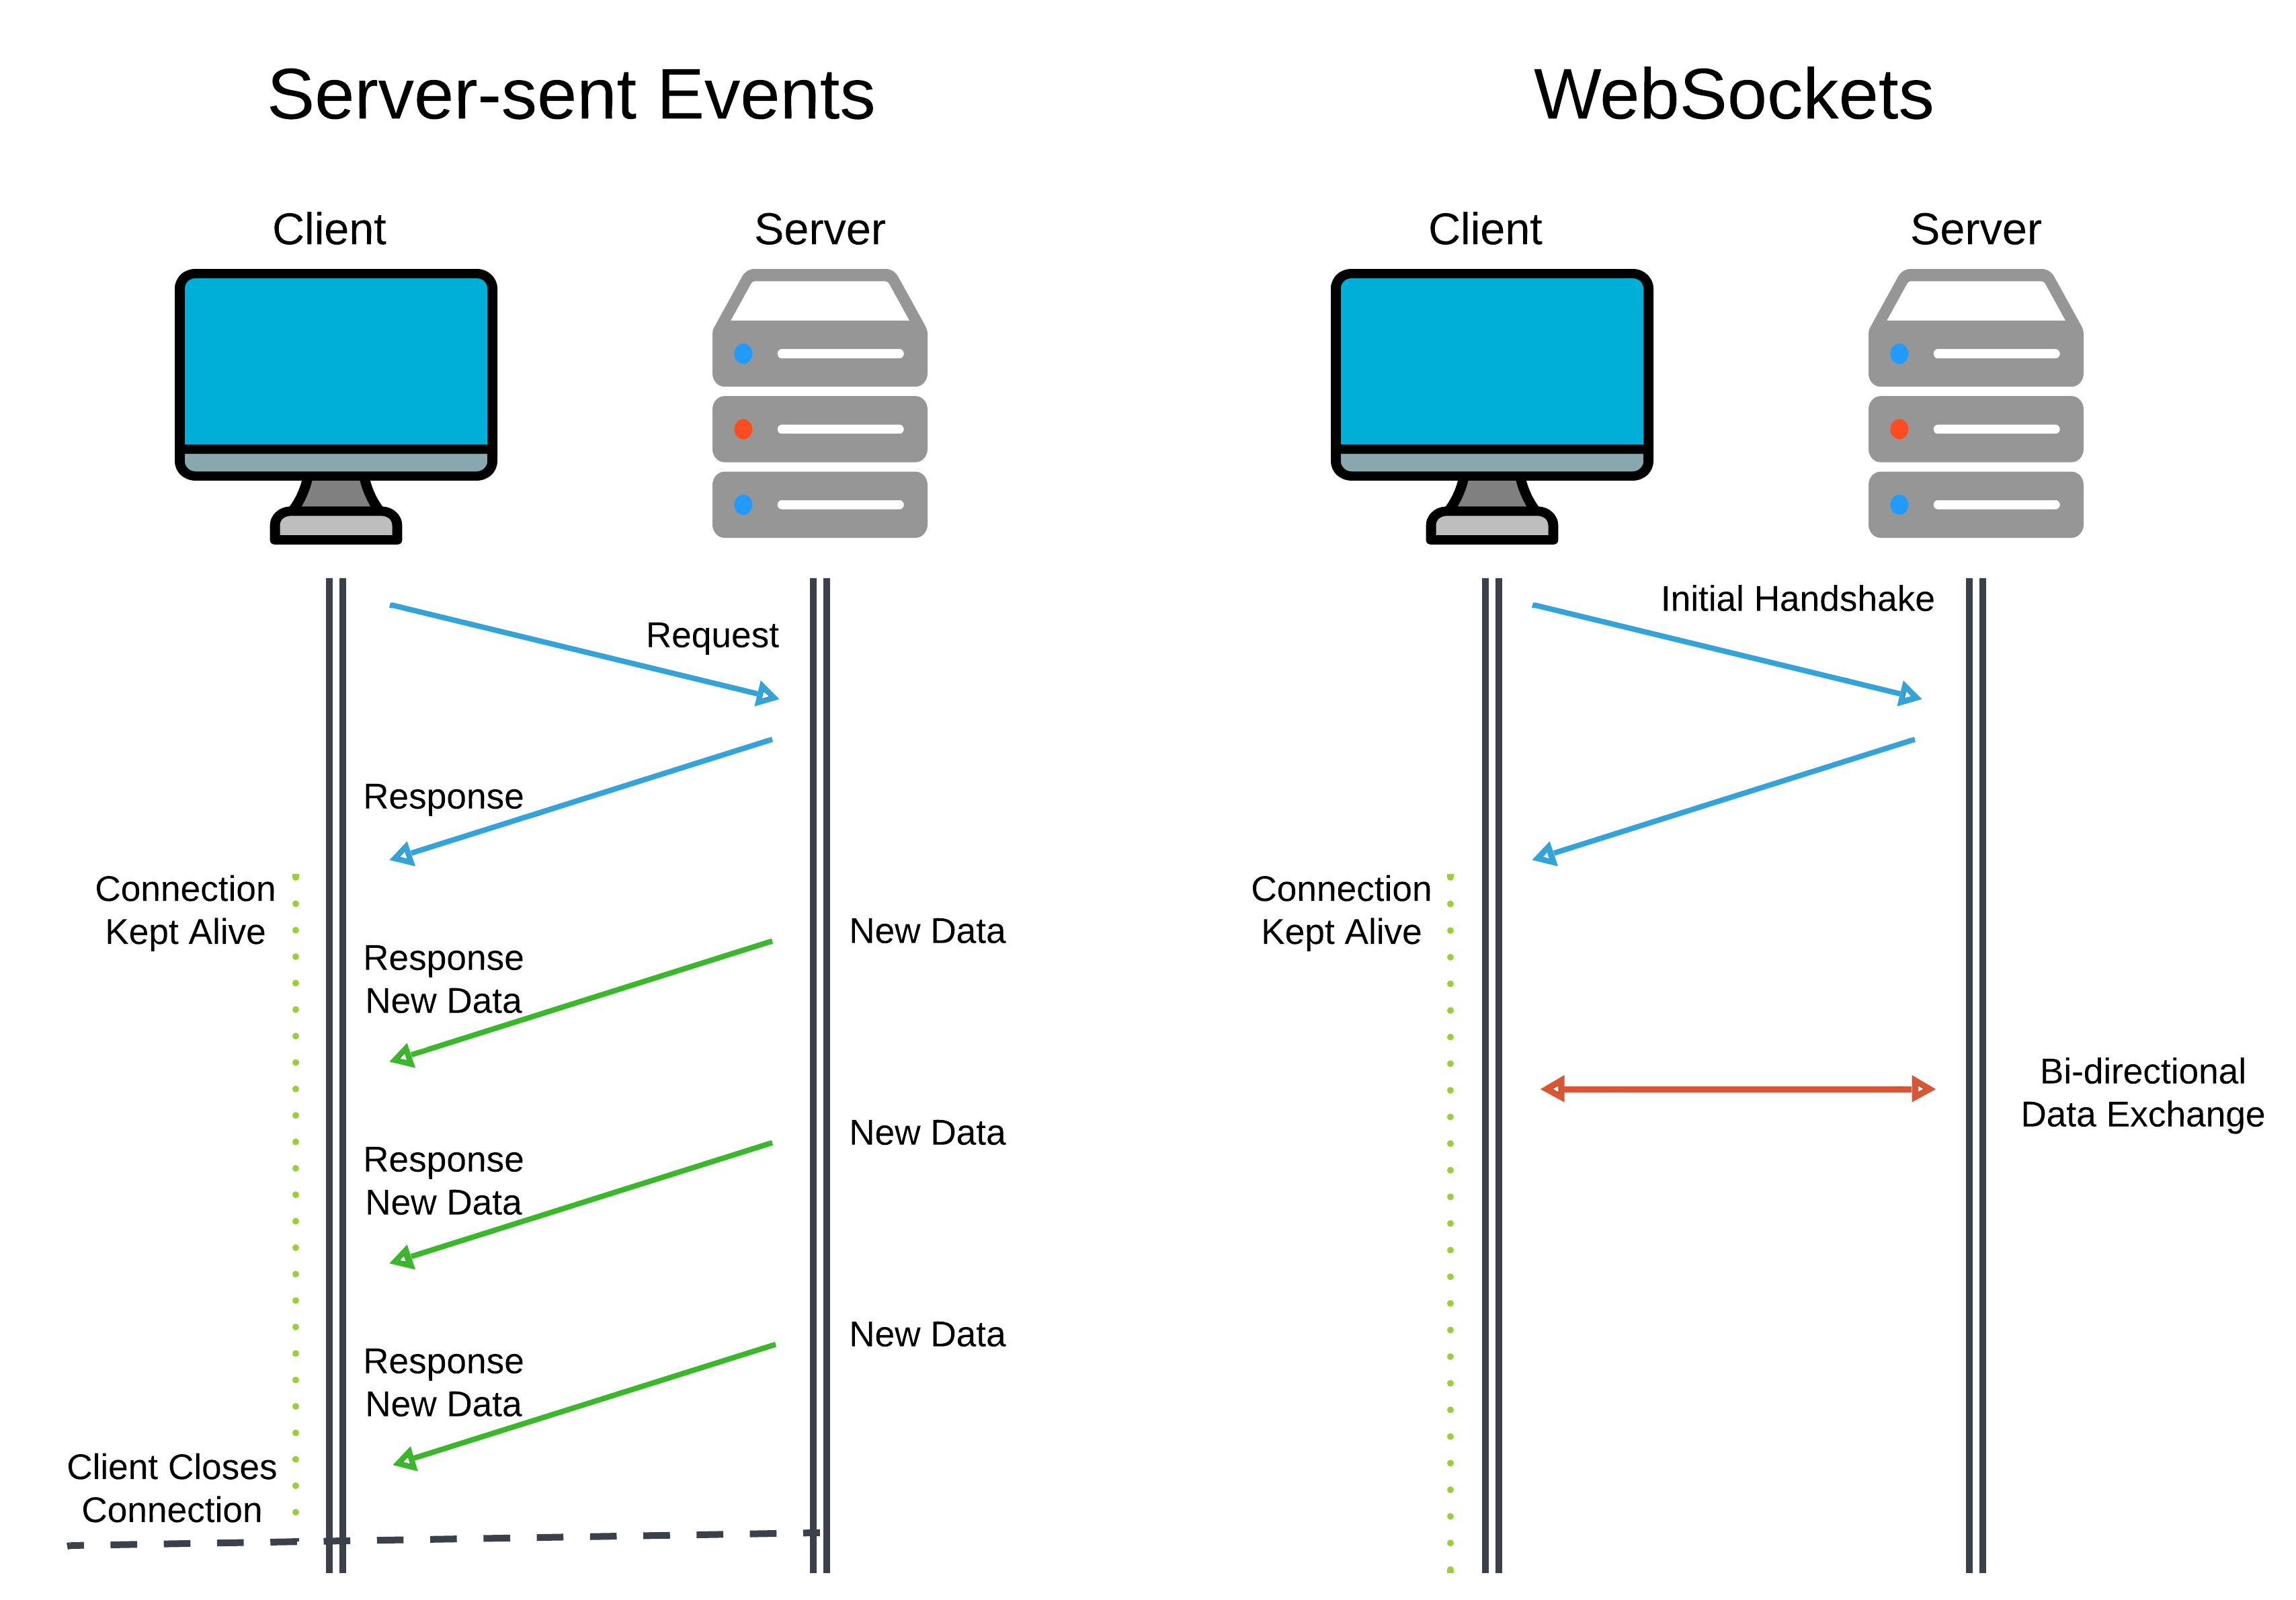
WebSockets also provide key security benefits. They allow for the secure transmission of tokens in headers rather than query strings, reducing the risks of sensitive data exposure. Additionally, WebSockets allow the creation of specific “rooms”11, ensuring that notifications are scoped only to users actively working on the relevant project. This feature is difficult to implement effectively with SSE, making WebSockets a more suitable choice for Flytrap’s project-specific notifications. A key tradeoff when using WebSockets is the need to handle both HTTP and WebSocket traffic on the same server, which can introduce scaling challenges under heavy load. However, Flytrap’s architecture intentionally separates high-load processing from the EC2 instance managing WebSocket traffic, ensuring that scaling concerns are minimized. The use of WebSockets also future-proofs the platform for bidirectional features such as collaborative debugging, which may be integrated into Flytrap’s roadmap.
Automated Deployment and Infrastructure Management
Problem: Complex AWS Manual Deployment
Self-hosting is a core aspect of Flytrap’s design, ensuring full control over infrastructure and data. However, manual deployment of AWS resources presents several challenges. Setting up infrastructure components like the EC2 instance, Lambda function, and API Gateway through manual configuration is error-prone and inefficient. The complexity of managing these resources manually can easily result in setup errors and deployment failure.
Solution: Infrastructure as Code with Terraform for Automated Deployment
To streamline the deployment process, Flytrap adopted Terraform, a popular infrastructure-as-code12 tool that allows users to define and manage infrastructure using configuration files. By adopting Terraform, Flytrap delivers key advantages:
-
Speed and Simplicity: Deployment is efficient, requiring only a few commands to configure Flytrap’s infrastructure.
-
Flexibility for Scaling: Users can easily adjust resource configurations to accommodate their application demands, such as increasing EC2 size for higher load capacity or scaling database instances.
-
Customizability: As Flytrap operates within the user’s AWS environment, organizations can tailor the deployment to align with specific compliance, security, or operational requirements.
With Terraform, deploying Flytrap becomes an automated process that only requires running a few commands. For instance, EC2 instance setup scripts handle tasks like Docker initialization, repository cloning, and Nginx configuration. This ensures that every deployment is identical and reduces the risk of human error.
Challenges such as managing resource dependencies and provisioning order were overcome by splitting some resources into provisioning and configuration modules to resolve dependency conflicts, avoid circular dependencies, and ensure correct permissions across infrastructure elements.
Using Flytrap
The process of using Flytrap begins with provisioning the architecture on AWS via Terraform. Once deployed, Flytrap integrates with applications through lightweight SDKs, with error data flowing directly into an intuitive dashboard for monitoring and resolution.
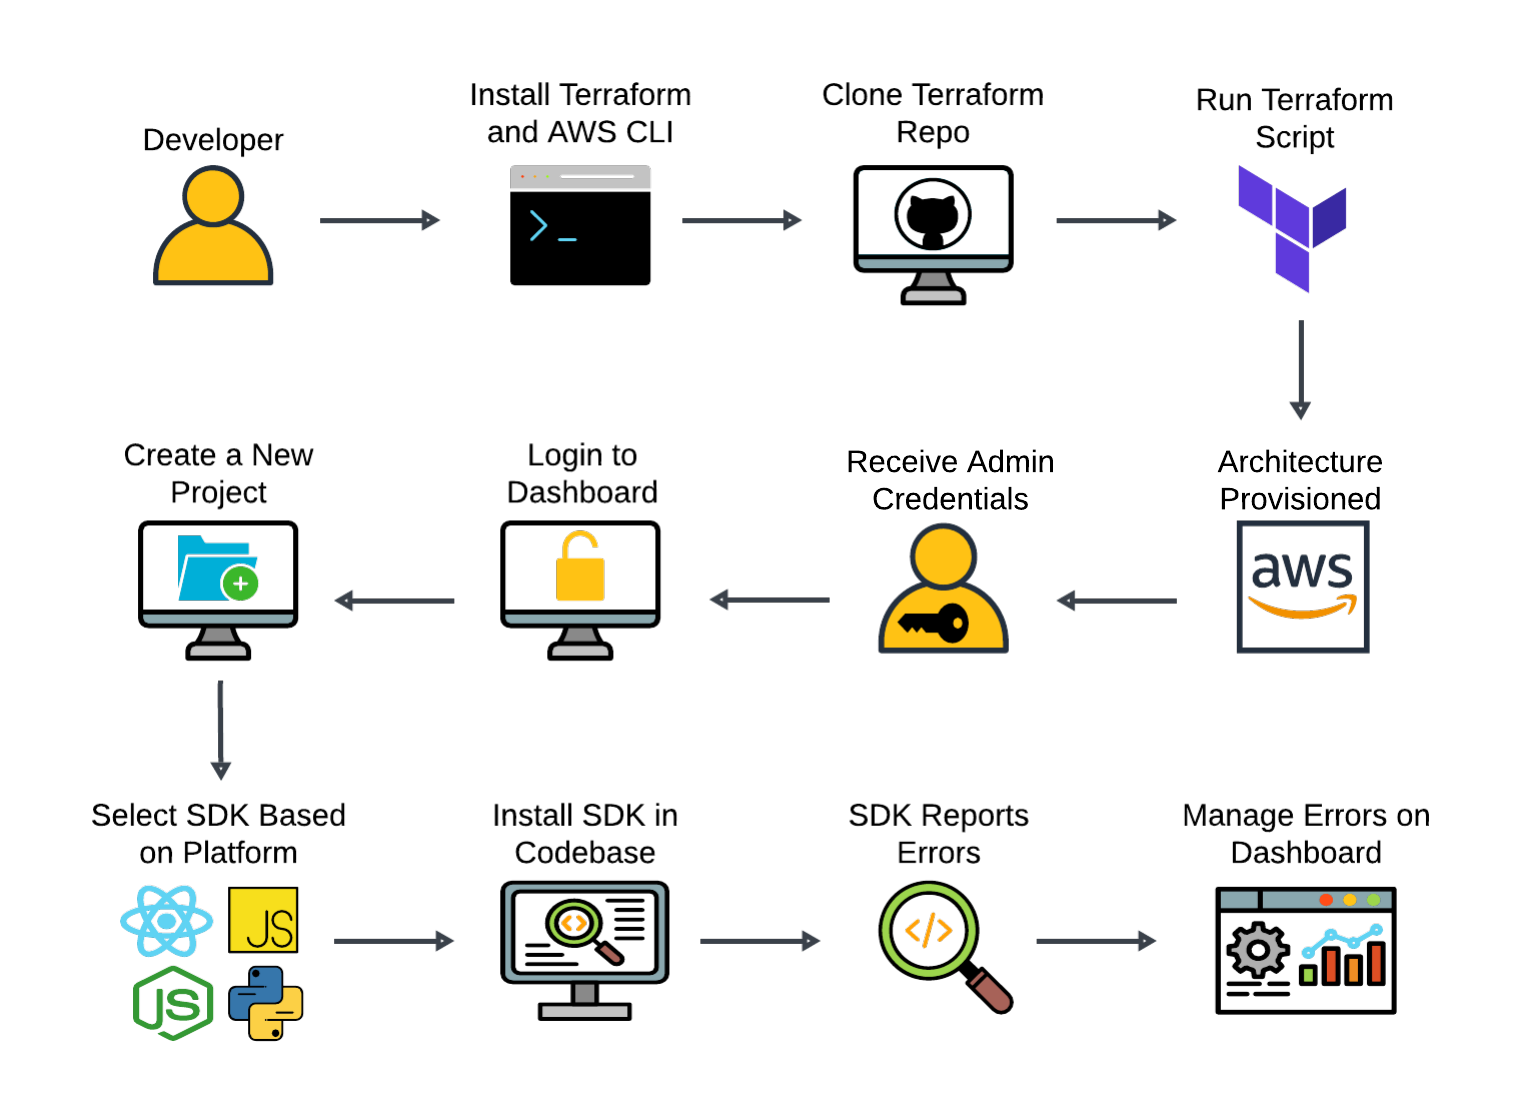
Visit our installation guide on GitHub to get started using Flytrap.
Future Work
As Flytrap continues to evolve, several enhancements are planned to refine the platform. These improvements will further streamline user workflows, increase automation, and improve error tracking and debugging capabilities.
Flytrap CLI
One planned development is the Flytrap CLI, which will abstract away setup steps, further reducing manual configuration and streamlining the process of managing infrastructure with Terraform. The Flytrap CLI will be the primary method for provisioning and managing Flytrap’s infrastructure without needing to manually interact with Terraform files, the AWS CLI, or the AWS console. It will also offer optional functionality to help automate source map upload and SSL/HTTPS configuration for the dashboard.
Error Monitoring Improvements
As Flytrap scales and matures, increased functionality in error tracking and handling is planned.
-
Error Aggregation: Flytrap will introduce more robust error aggregation features, allowing it to intelligently group similar errors and highlight patterns or recurring issues. This will enable developers to quickly identify systemic problems and prioritize them accordingly.
-
Breadcrumbs: To provide better context when debugging, breadcrumbs will be added to error logs. These breadcrumbs will record significant events leading up to an error, giving developers a better understanding of the state of the application at the time of the issue.
-
Supporting Versions/Release Tracking: Flytrap plans to implement version and release tracking, allowing developers to identify which versions or releases are associated with specific errors.
These features will enhance Flytrap's core capabilities while providing tools for more finely-grained error monitoring, helping developers understand the root cause of issues more quickly and resolve issues more efficiently.
References
- Express: Error Handling
- Python: Exception Hierarchy
- NodeJS: Event: “unhandledRejection”
- Python: sys — System-specific parameters and functions
- Flask: Handling Application Errors
- Microsoft: Queue-Based Load Leveling pattern
- Chrome: What Are Source Maps?
- MDN: Server-sent events
- Python: PEP 3333 – Python Web Server Gateway Interface
- IETF: The WebSocket Protocol
- Socket.io: Rooms
- Terraform: What is Infrastructure as Code with Terraform?