How to Use Flytrap
This guide walks you through how to use both the Admin Console and Developer Dashboard.
Admin Console
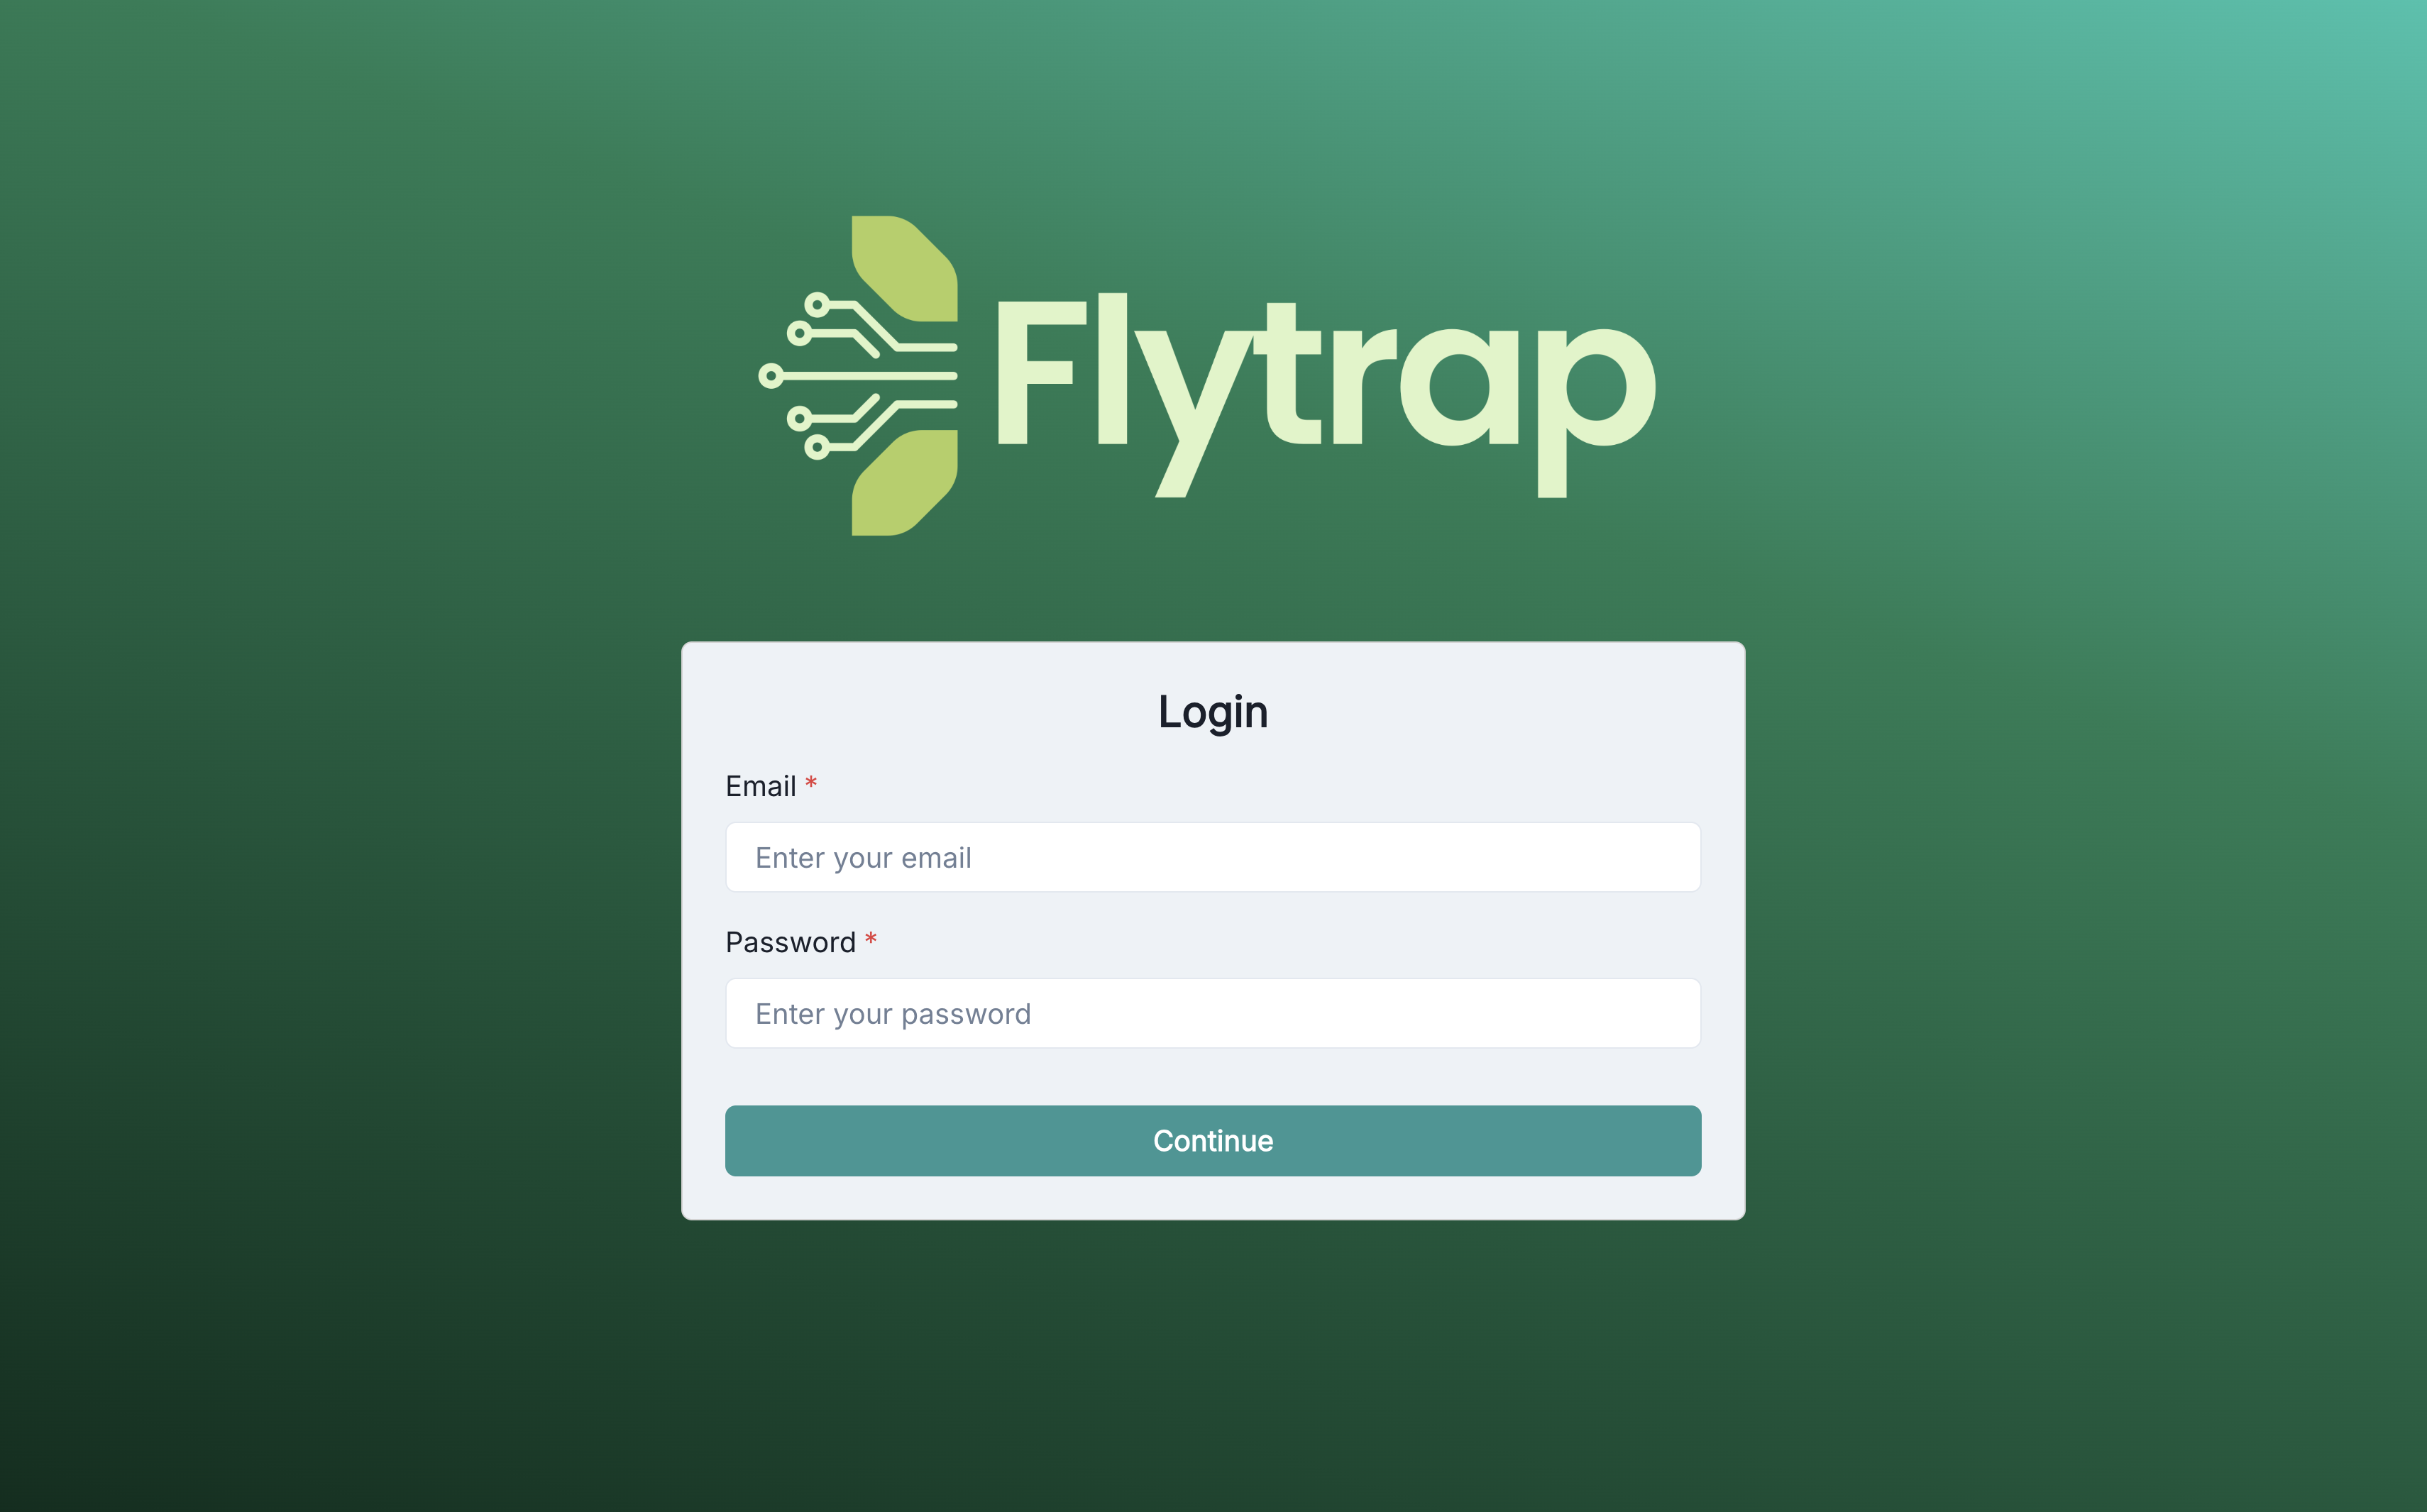
🔐 Log in to the Admin Console
- Access the Dashboard: Open your browser and navigate to the Flytrap client dashboard URL. If you've configured a custom domain, use that instead.
- Log In: Enter the default admin email and password provided in the Terraform command line outputs.
- Update Credentials: After logging in, select Change Password to update your default admin email and password for security.
📁 Create Projects
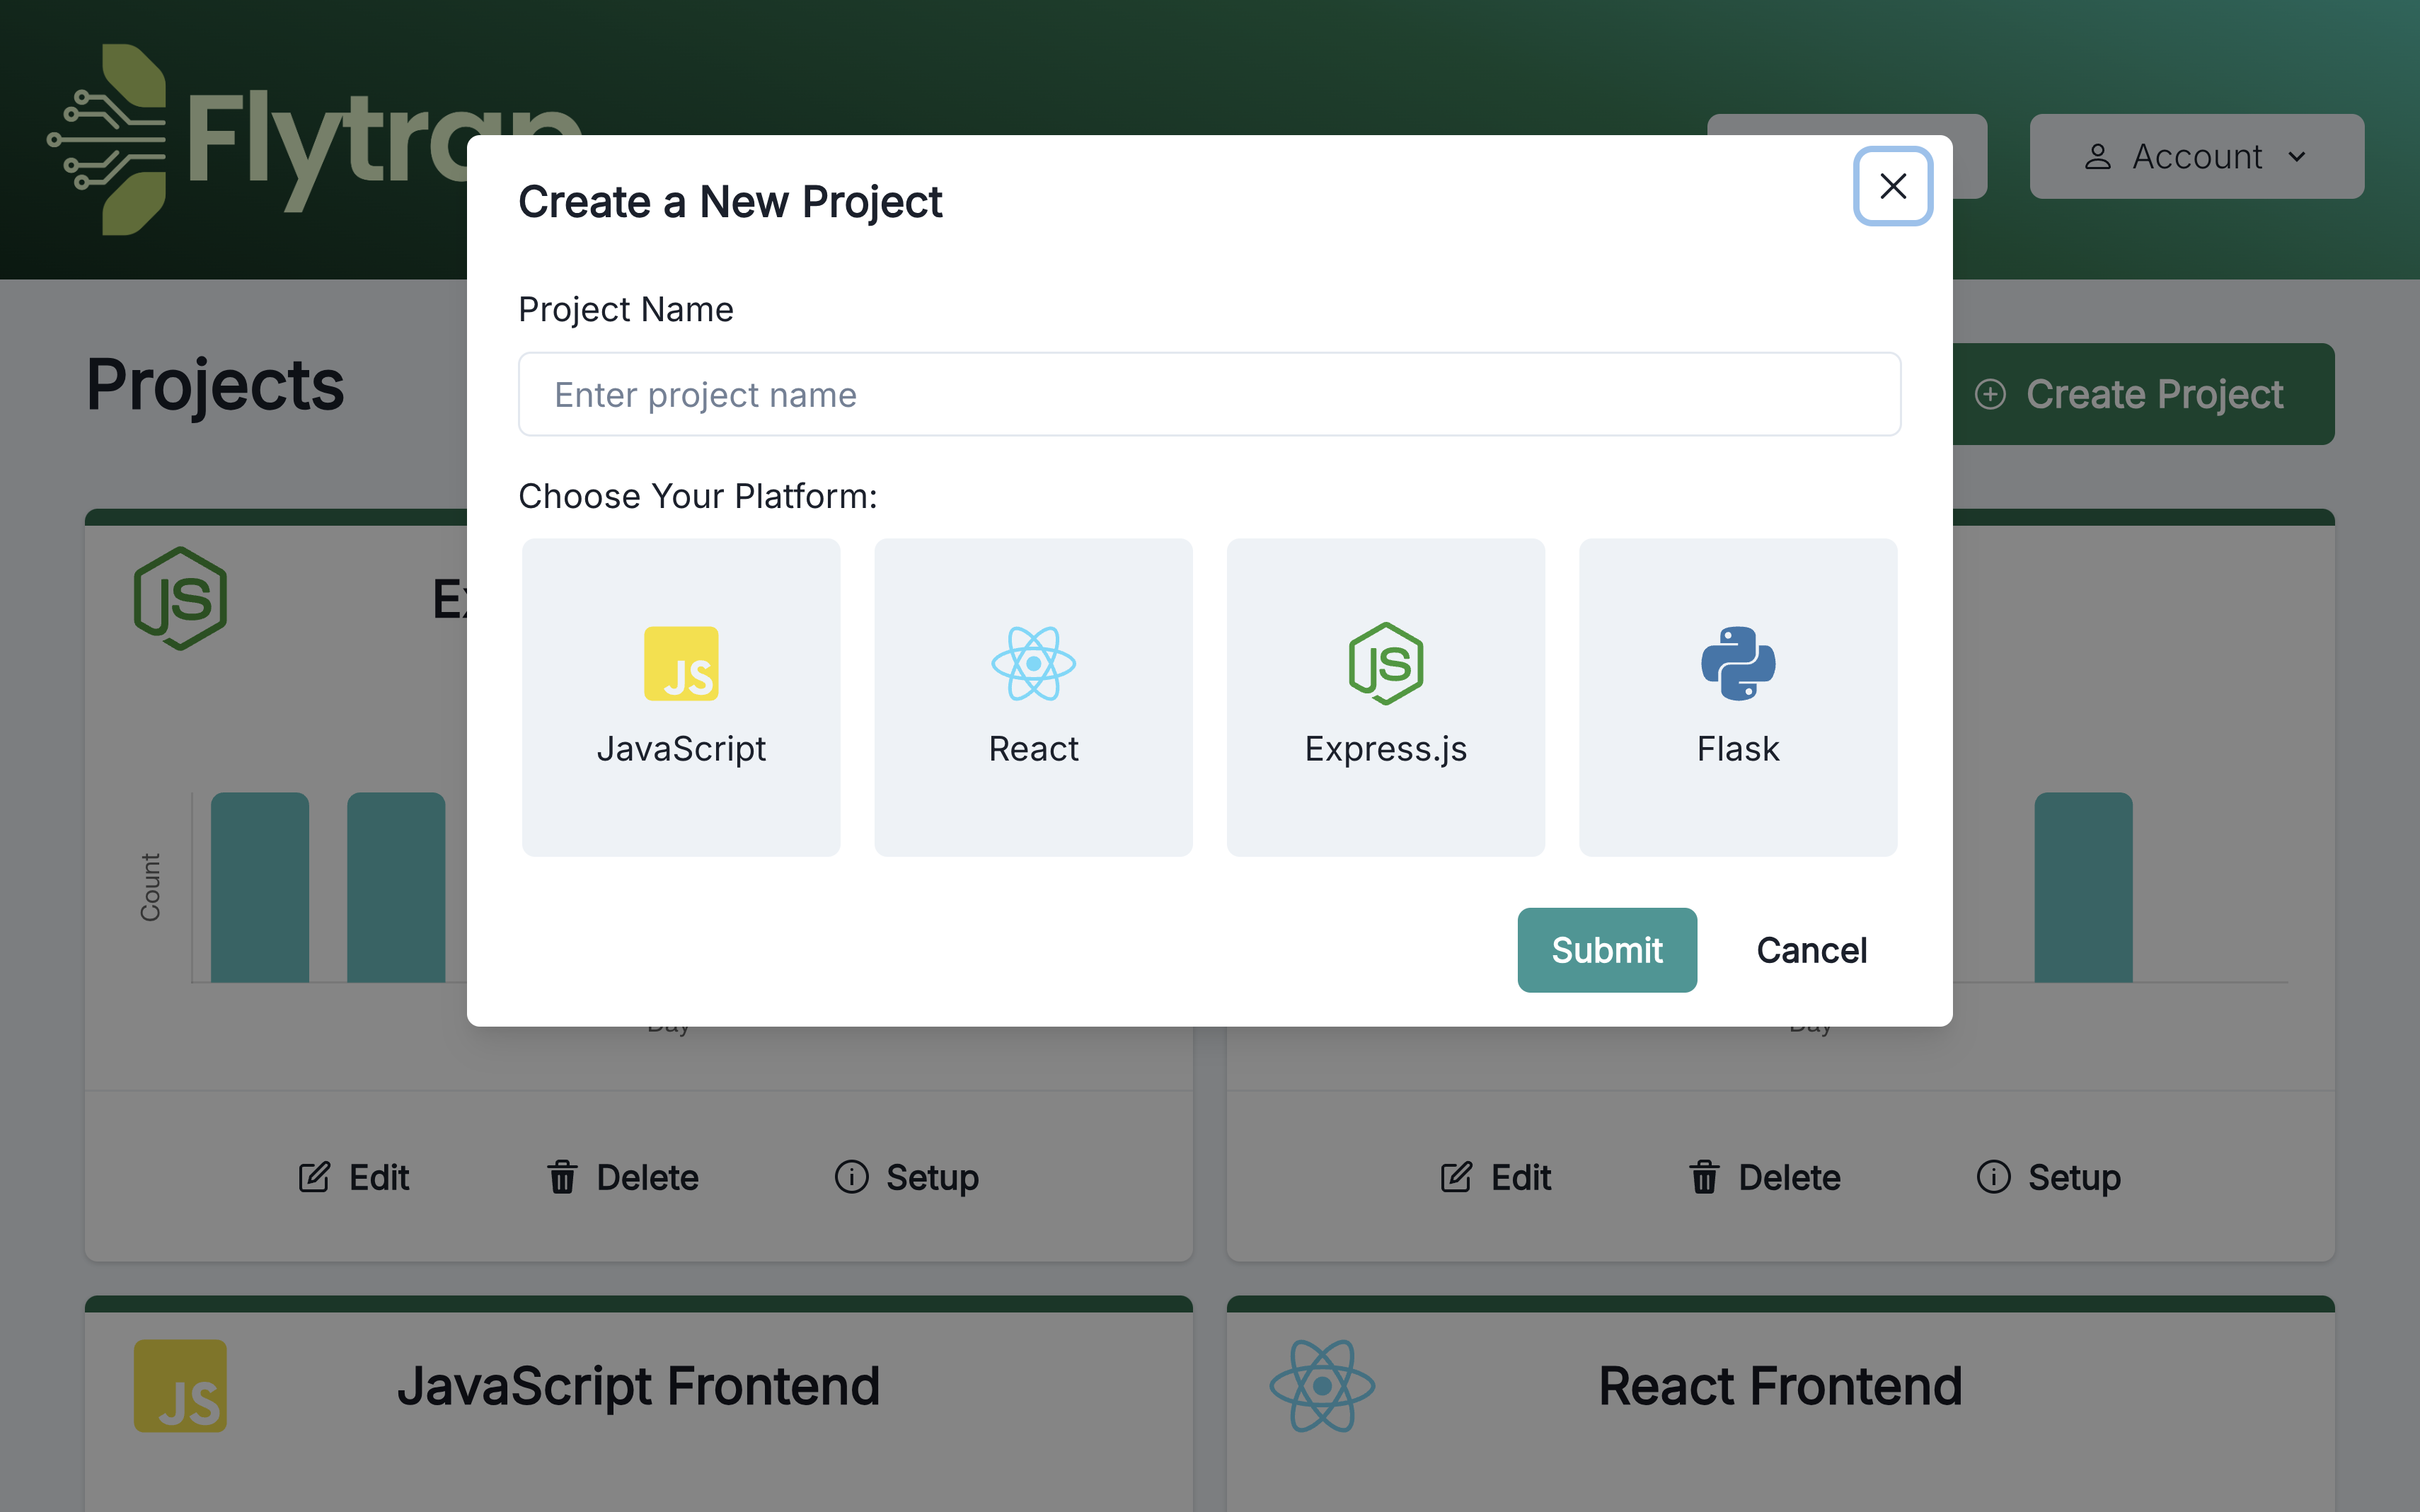
- Navigate to Projects: Click on Create Project in the Admin Console.
- Name: Enter a unique name for your project.
- Select SDK: Choose from the available SDKs (React, Vanilla JS, Express, Flask).
🖥️ Set Up the SDK
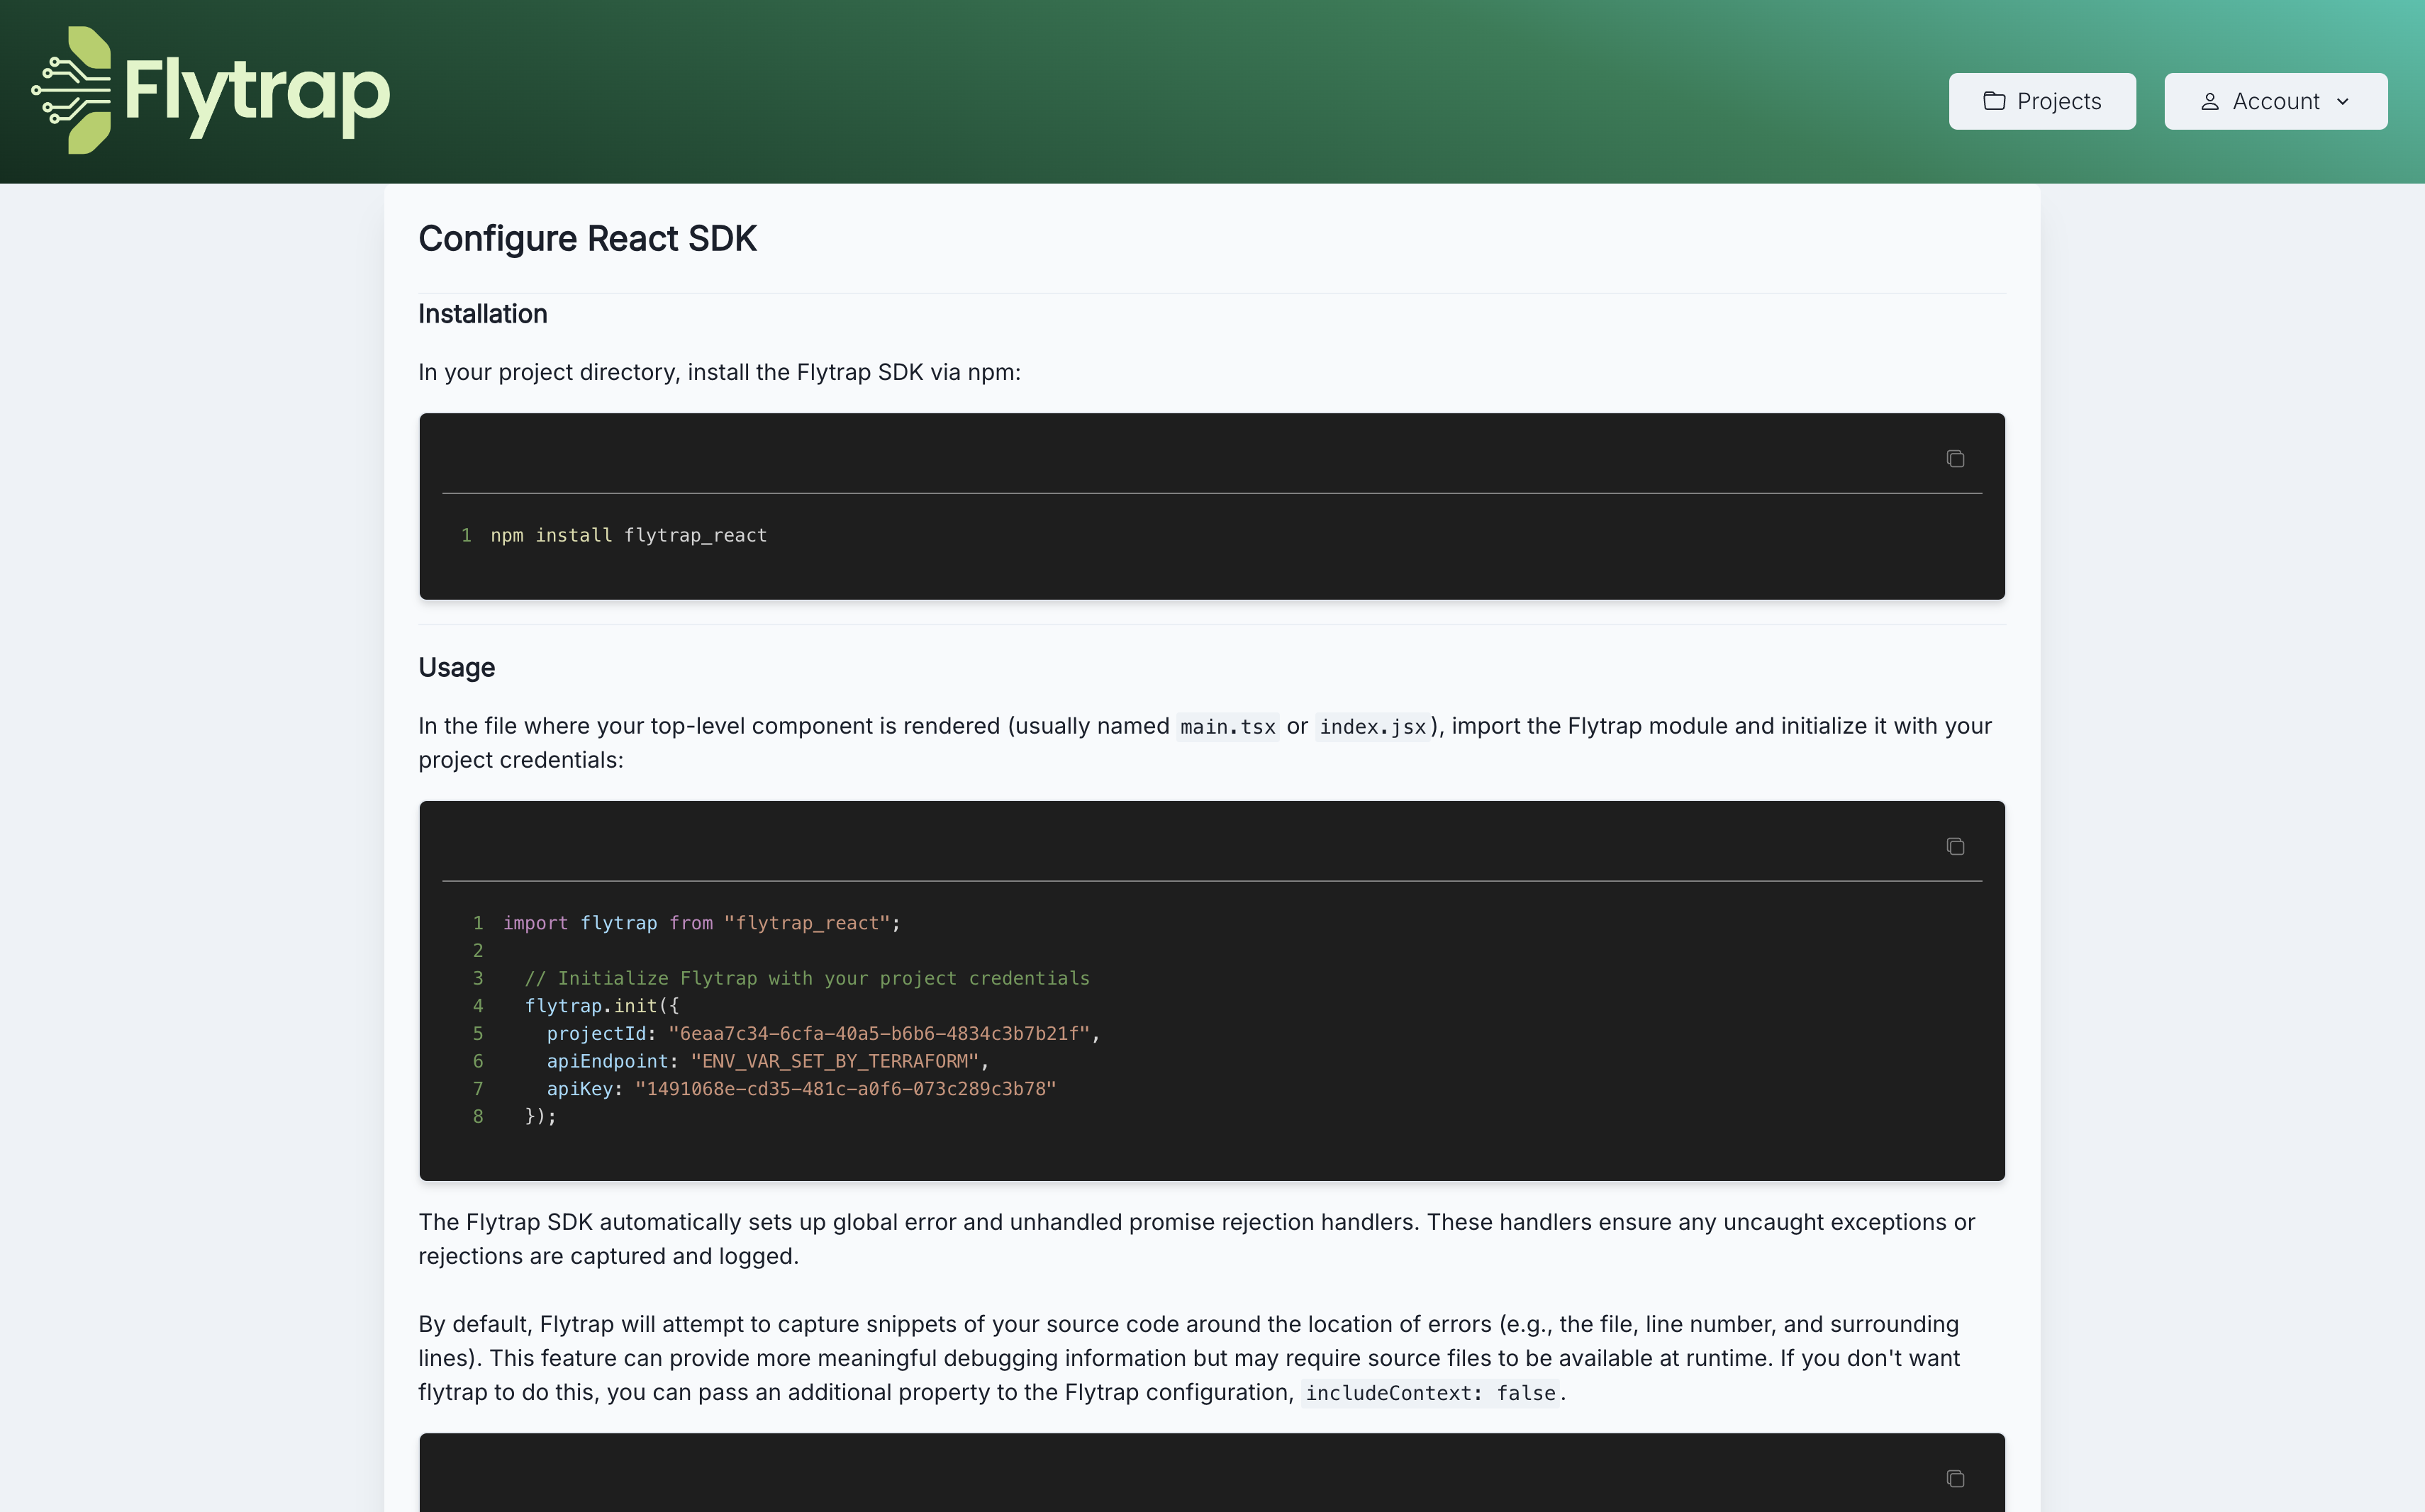
Flytrap provides detailed installation instructions for each SDK:
- React and Express SDKs: Available as npm packages.
- Flask SDK: Available as a PyPi package.
- Vanilla JS SDK: Install by adding a
<script>tag to your existing application.
Initialization:
- Use the provided code snippet to initialize the Flytrap SDK in your application.
- Optionally, manually add Flytrap's
captureExceptionmethod within your code (e.g., inside atry/catch block) to capture handled errors.
👥 Add Users to Projects
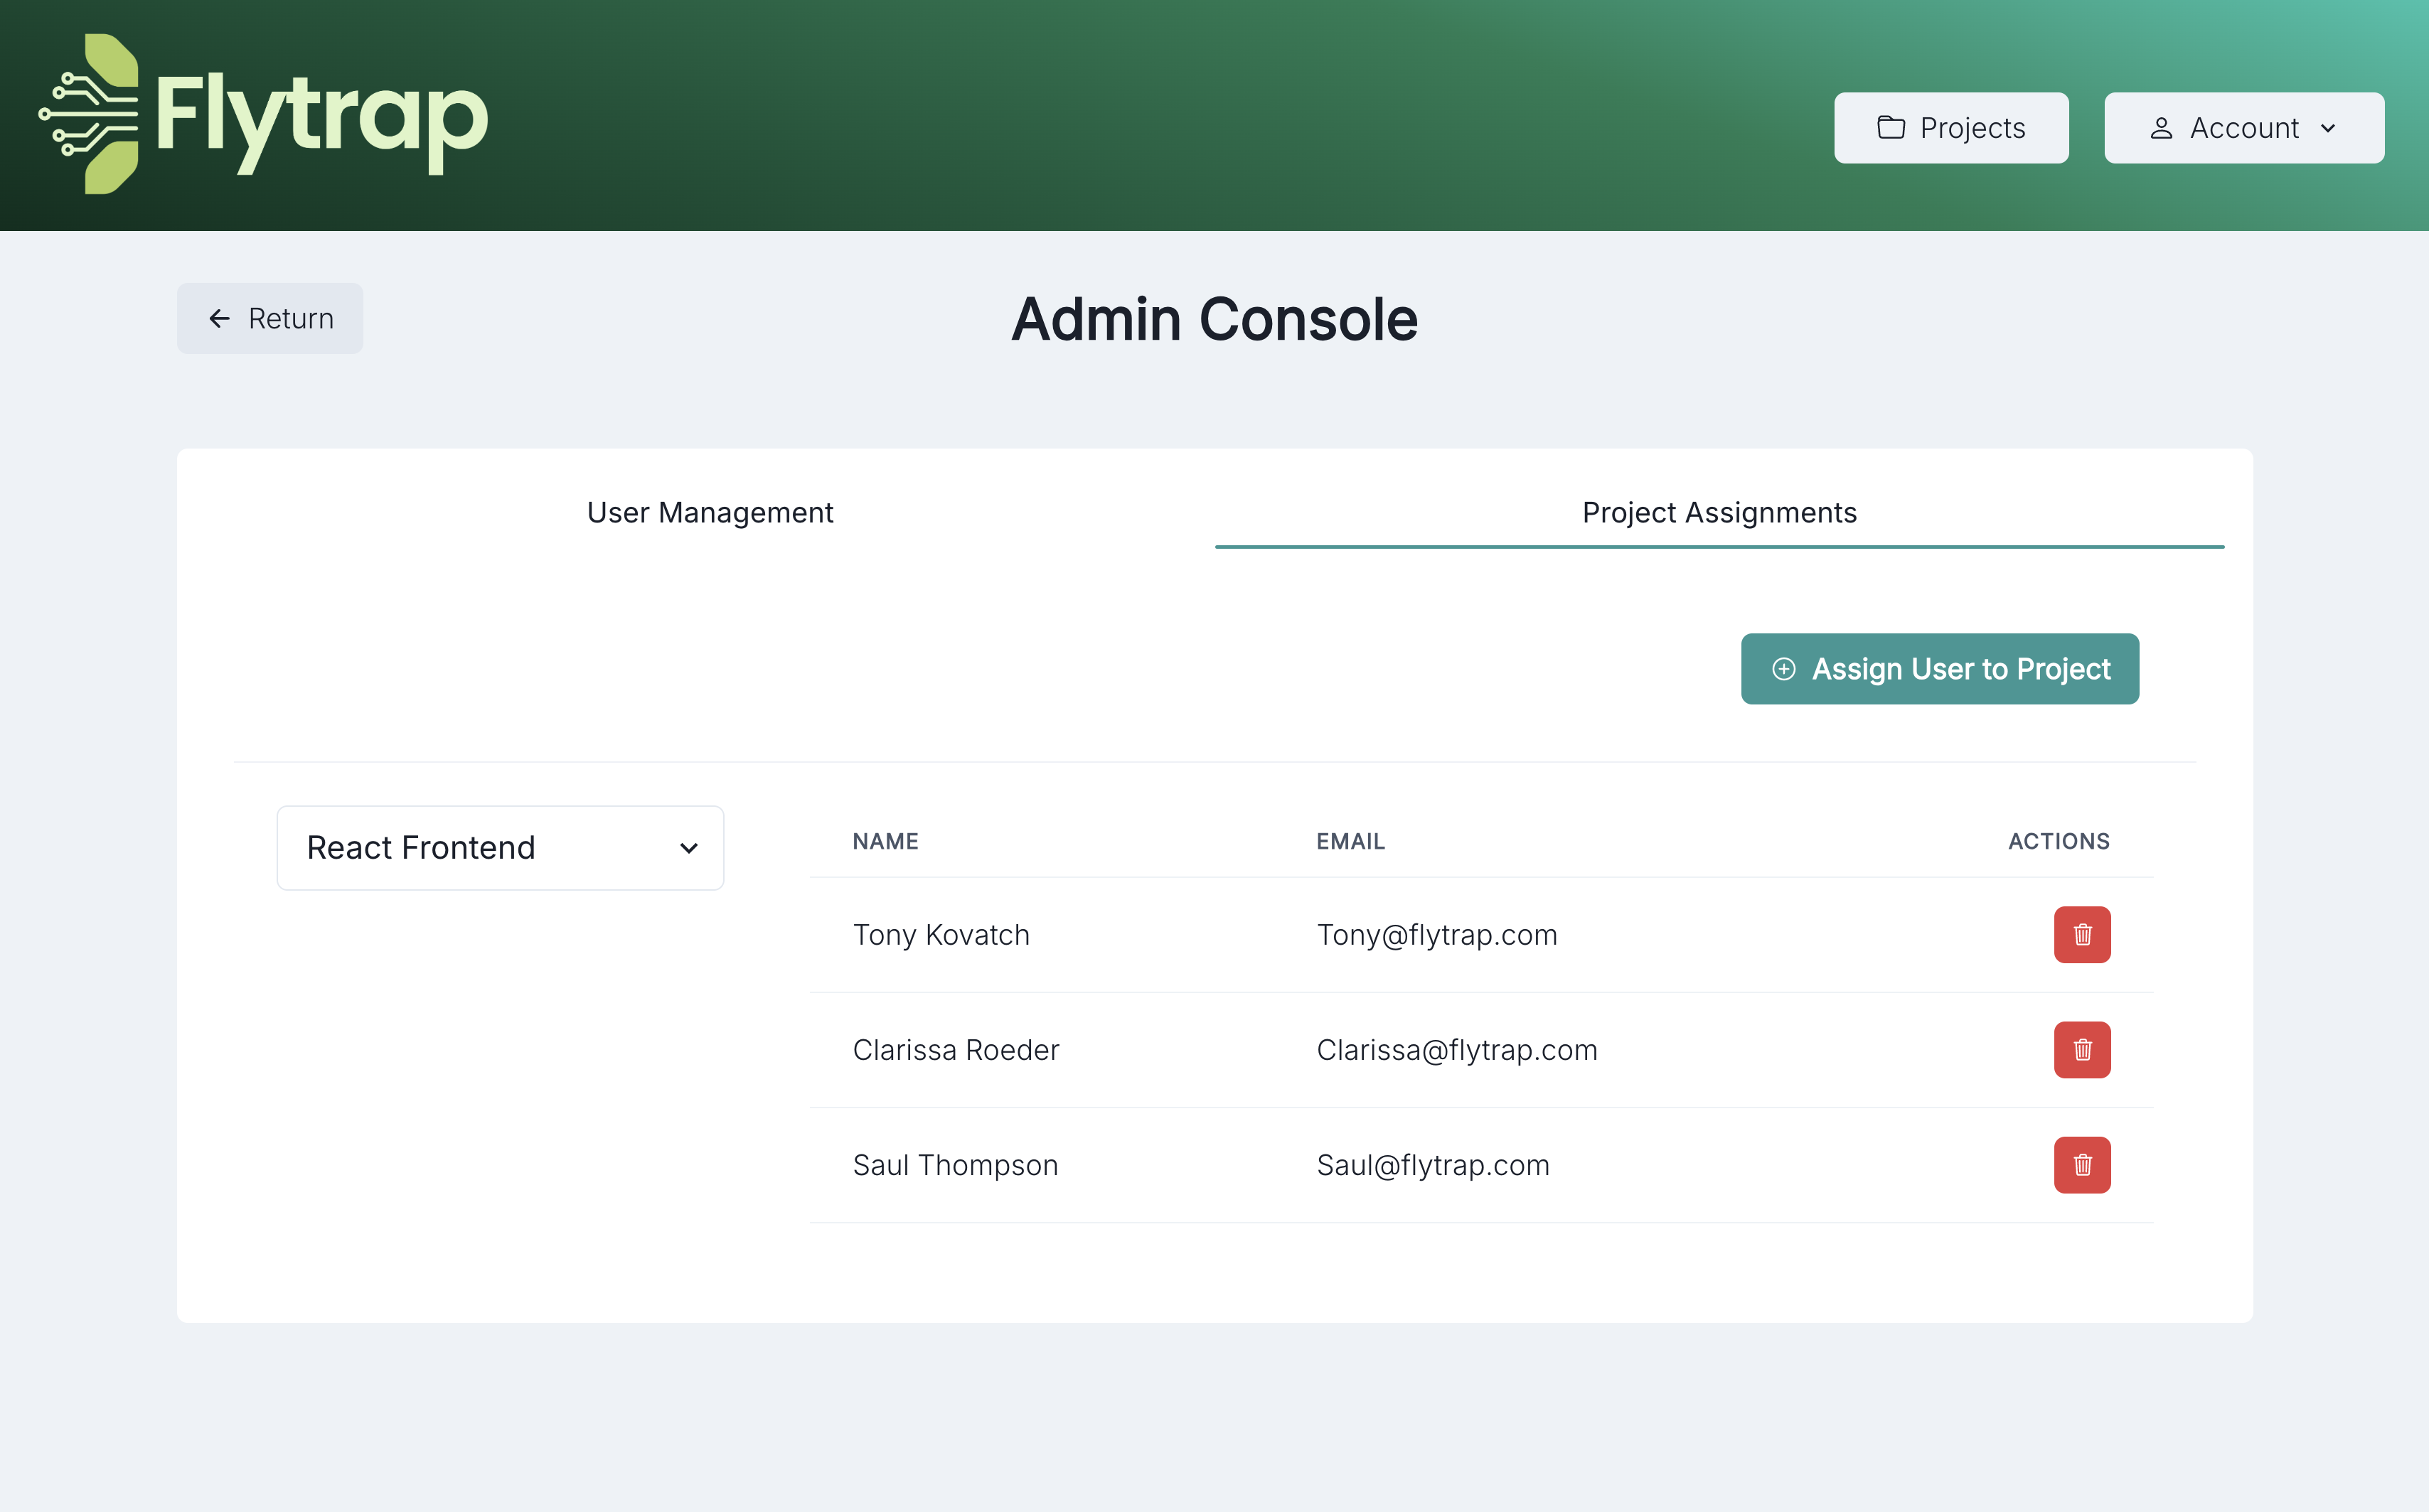
Once a Flytrap SDK is initialized in your application, you can add developers to each project.
- Add Developers:
- Click on Create New User in the Admin Console.
- Enter the user's details and assign them to specific projects.
- Access Control: Users will only have access to error data for the projects they are assigned to.
🧪 Test Flytrap Setup
- Generate a Sample Error: Use the provided code snippet from the SDK setup instructions to create a test error in your application.
- Verify Setup: Confirm that the sample error appears in the Flytrap dashboard, ensuring the SDK and infrastructure are correctly configured.
Developer Dashboard
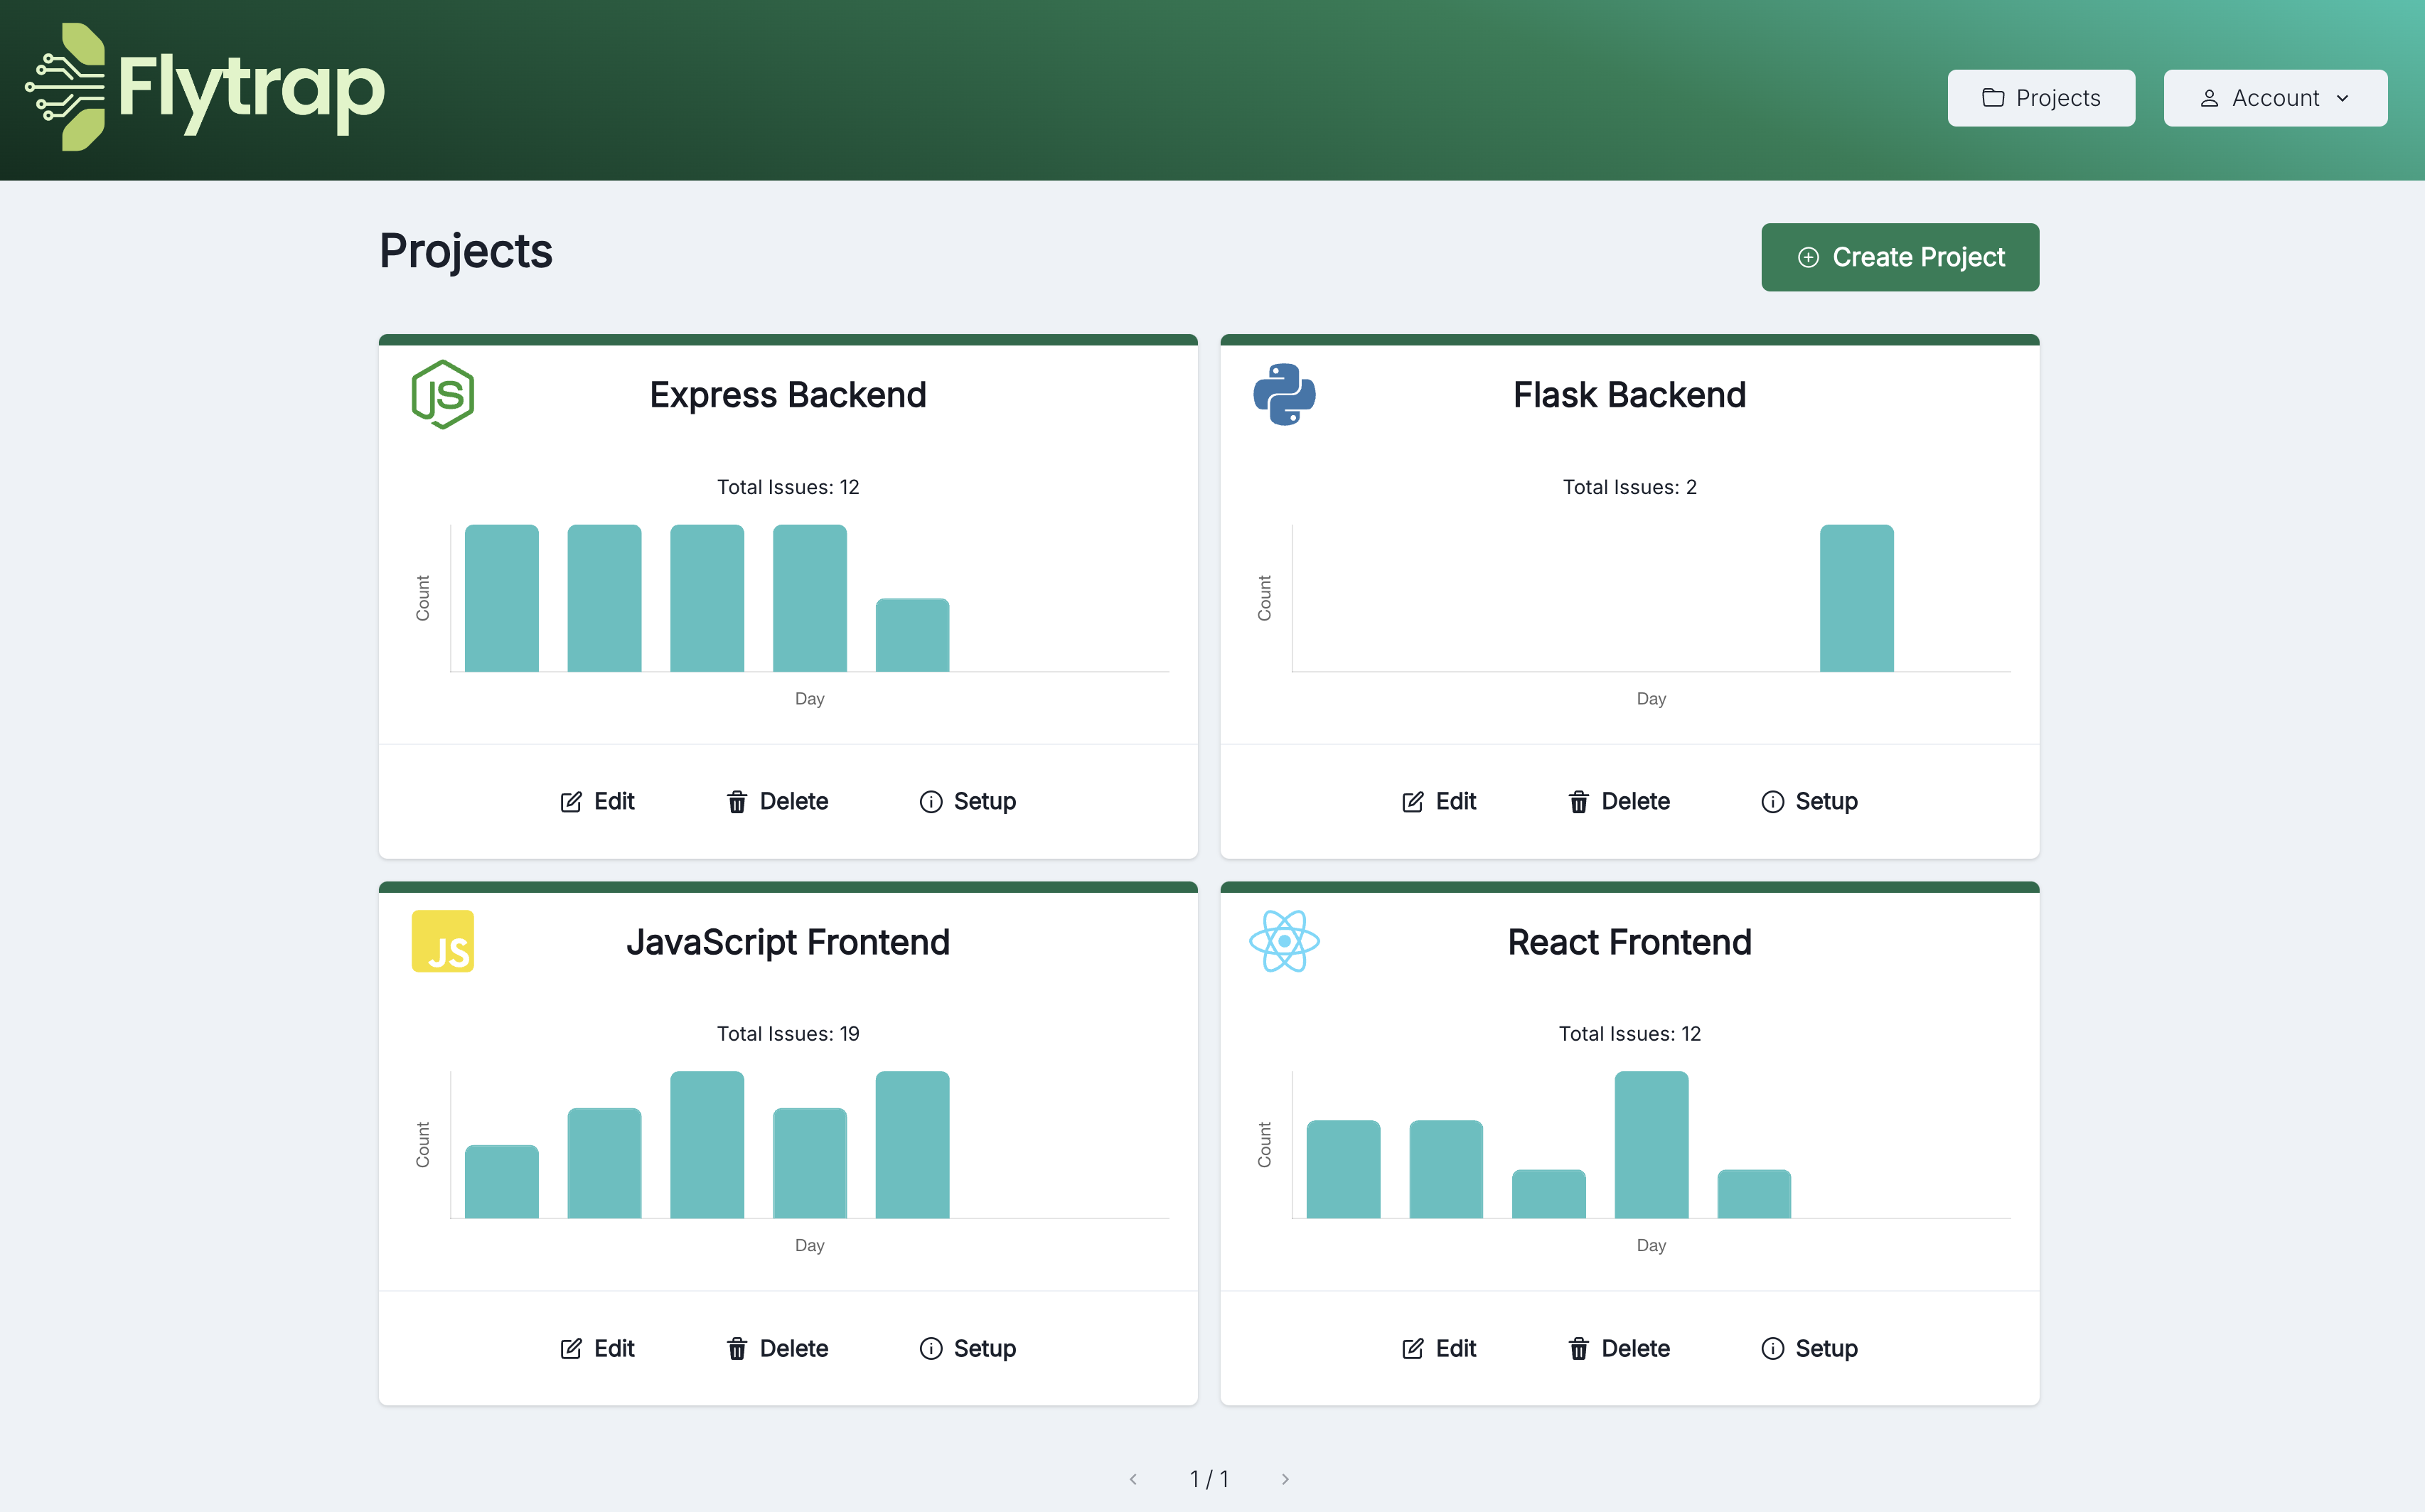
👩💻 Access the Dashboard
- Login: After being assigned to a project, log in to the Flytrap dashboard using your credentials.
- Dashboard Overview: The dashboard serves as the central hub for monitoring and resolving errors in near real-time.
🔍 View and Filter Errors
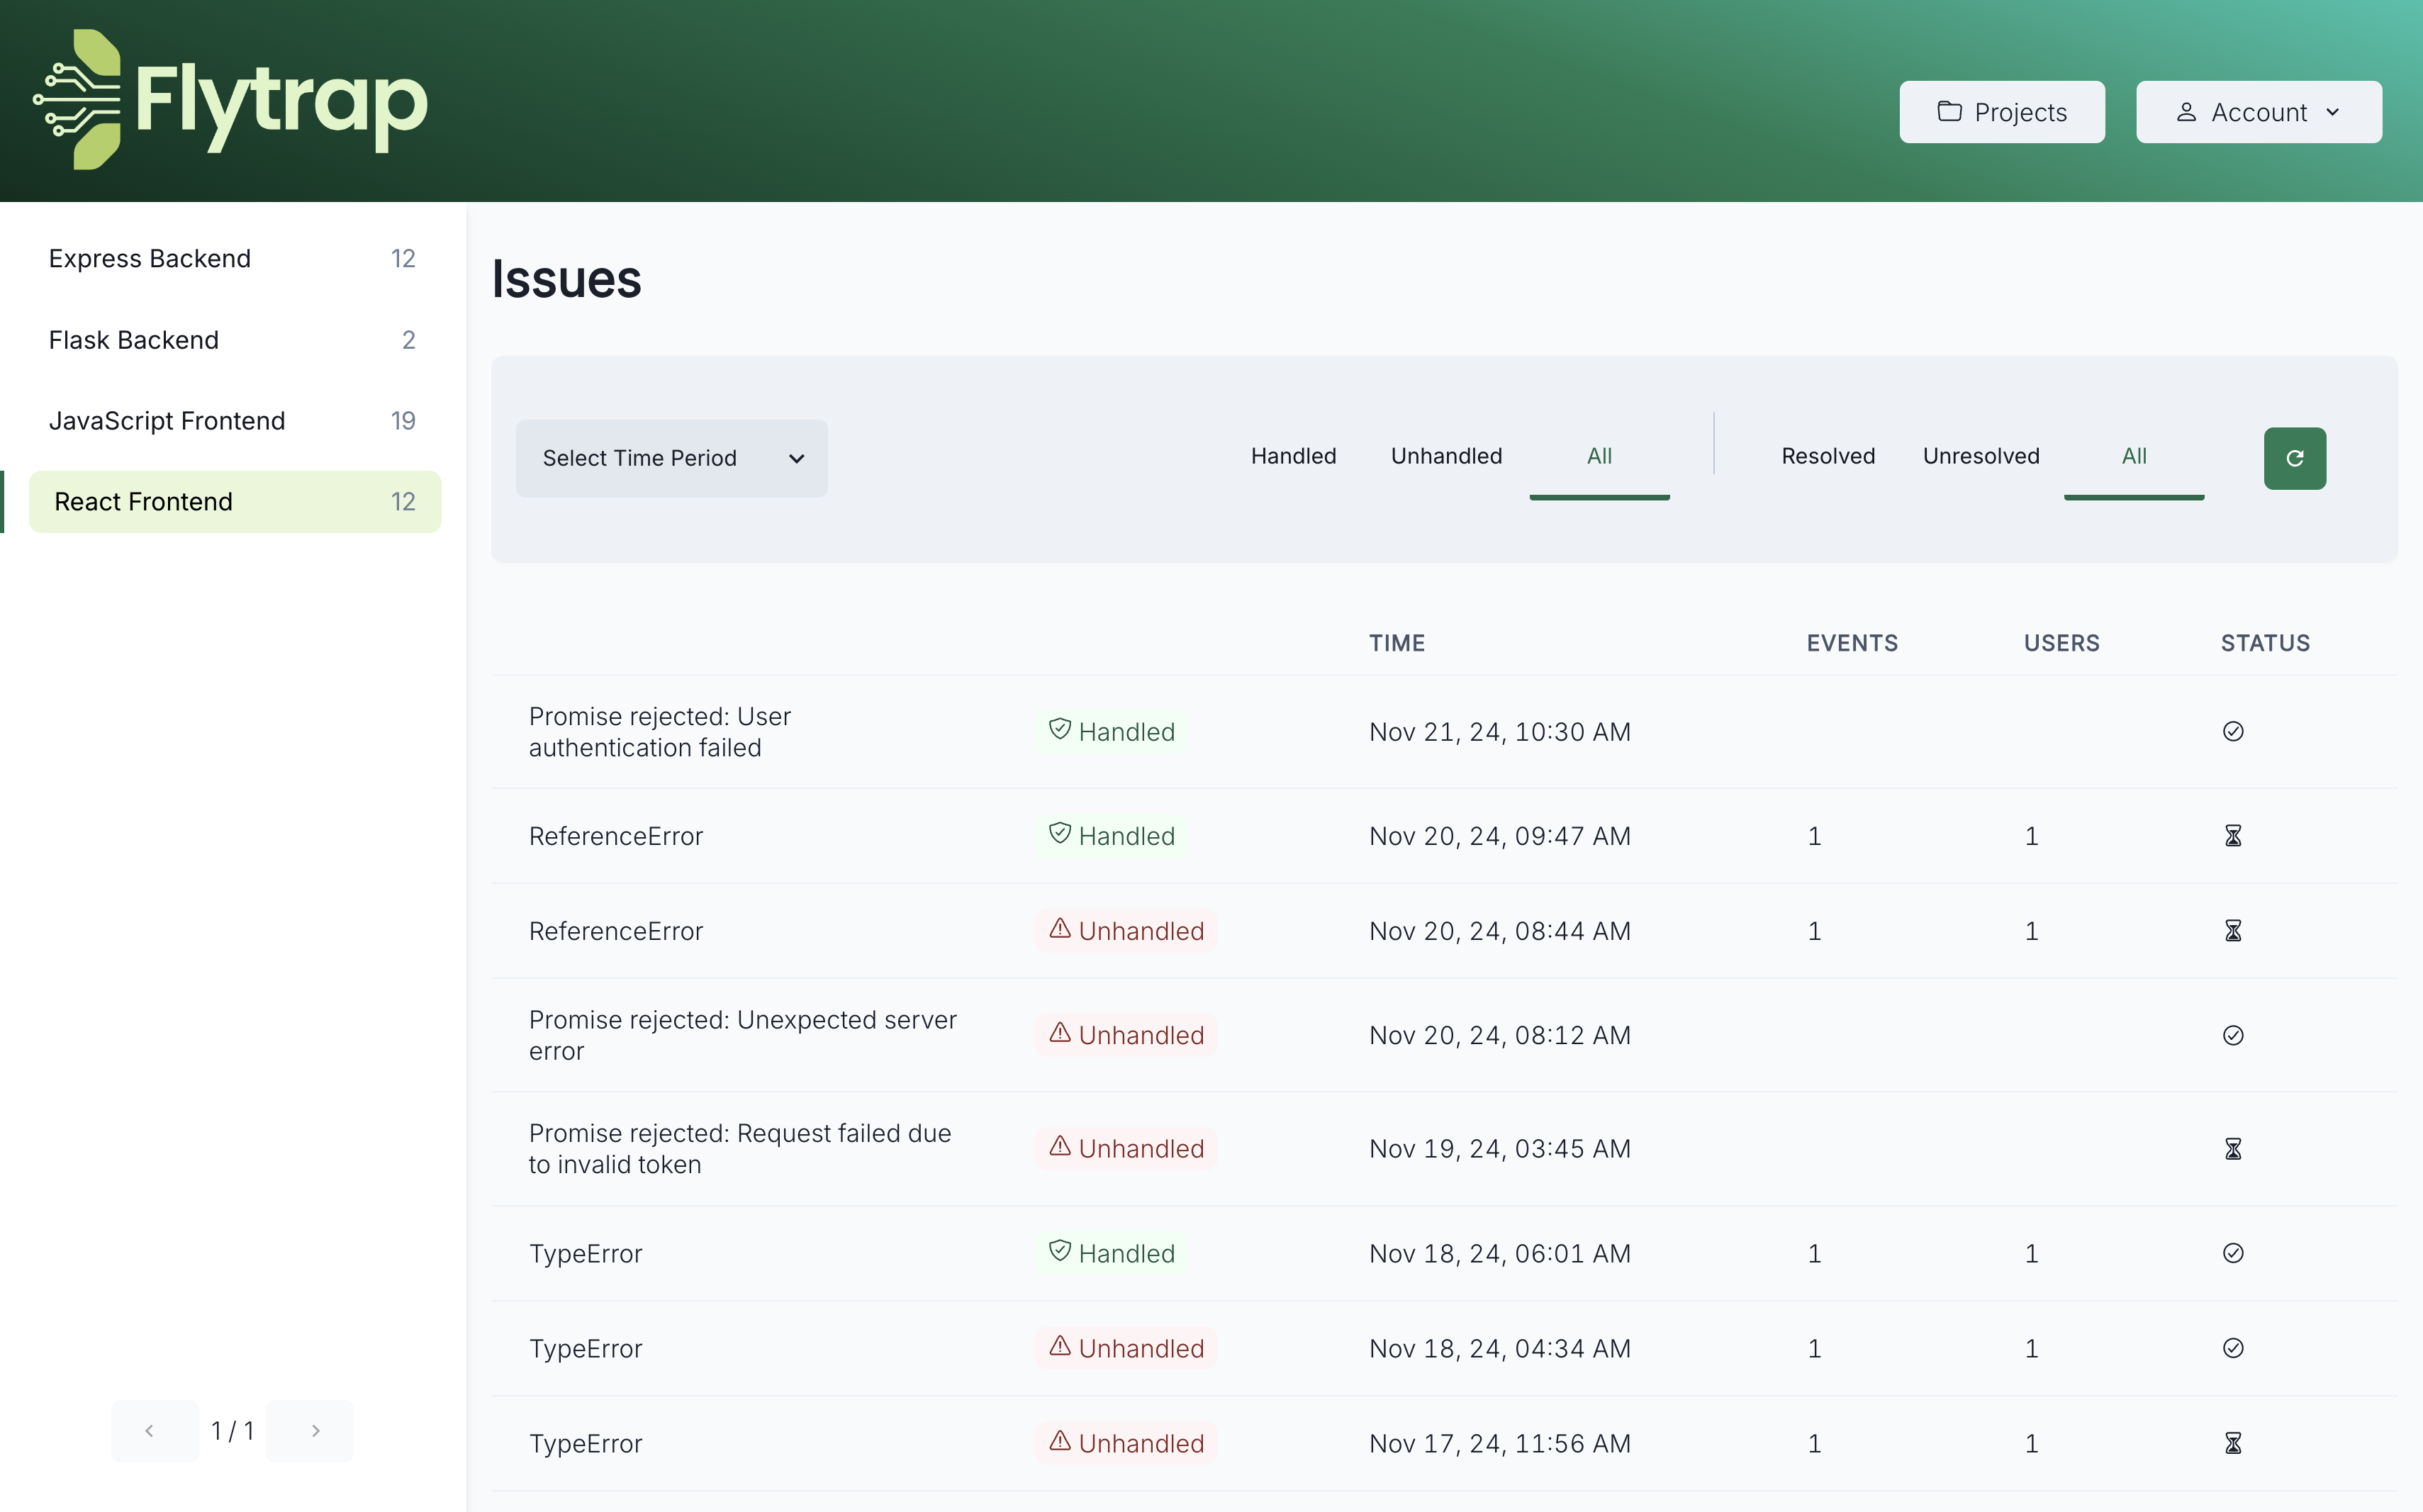
- Navigate to Issues: Go to the Issues page to see all project errors.
- Use Filtering Tools: Apply filters to focus on:
- Handled vs. Unhandled Errors
- Resolved vs. Unresolved Errors
- Specific Time Periods
These filters help prioritize fixes based on user impact and urgency.
📊 View Error Data
The dashboard provides an overview of all captured errors, sorted by project:
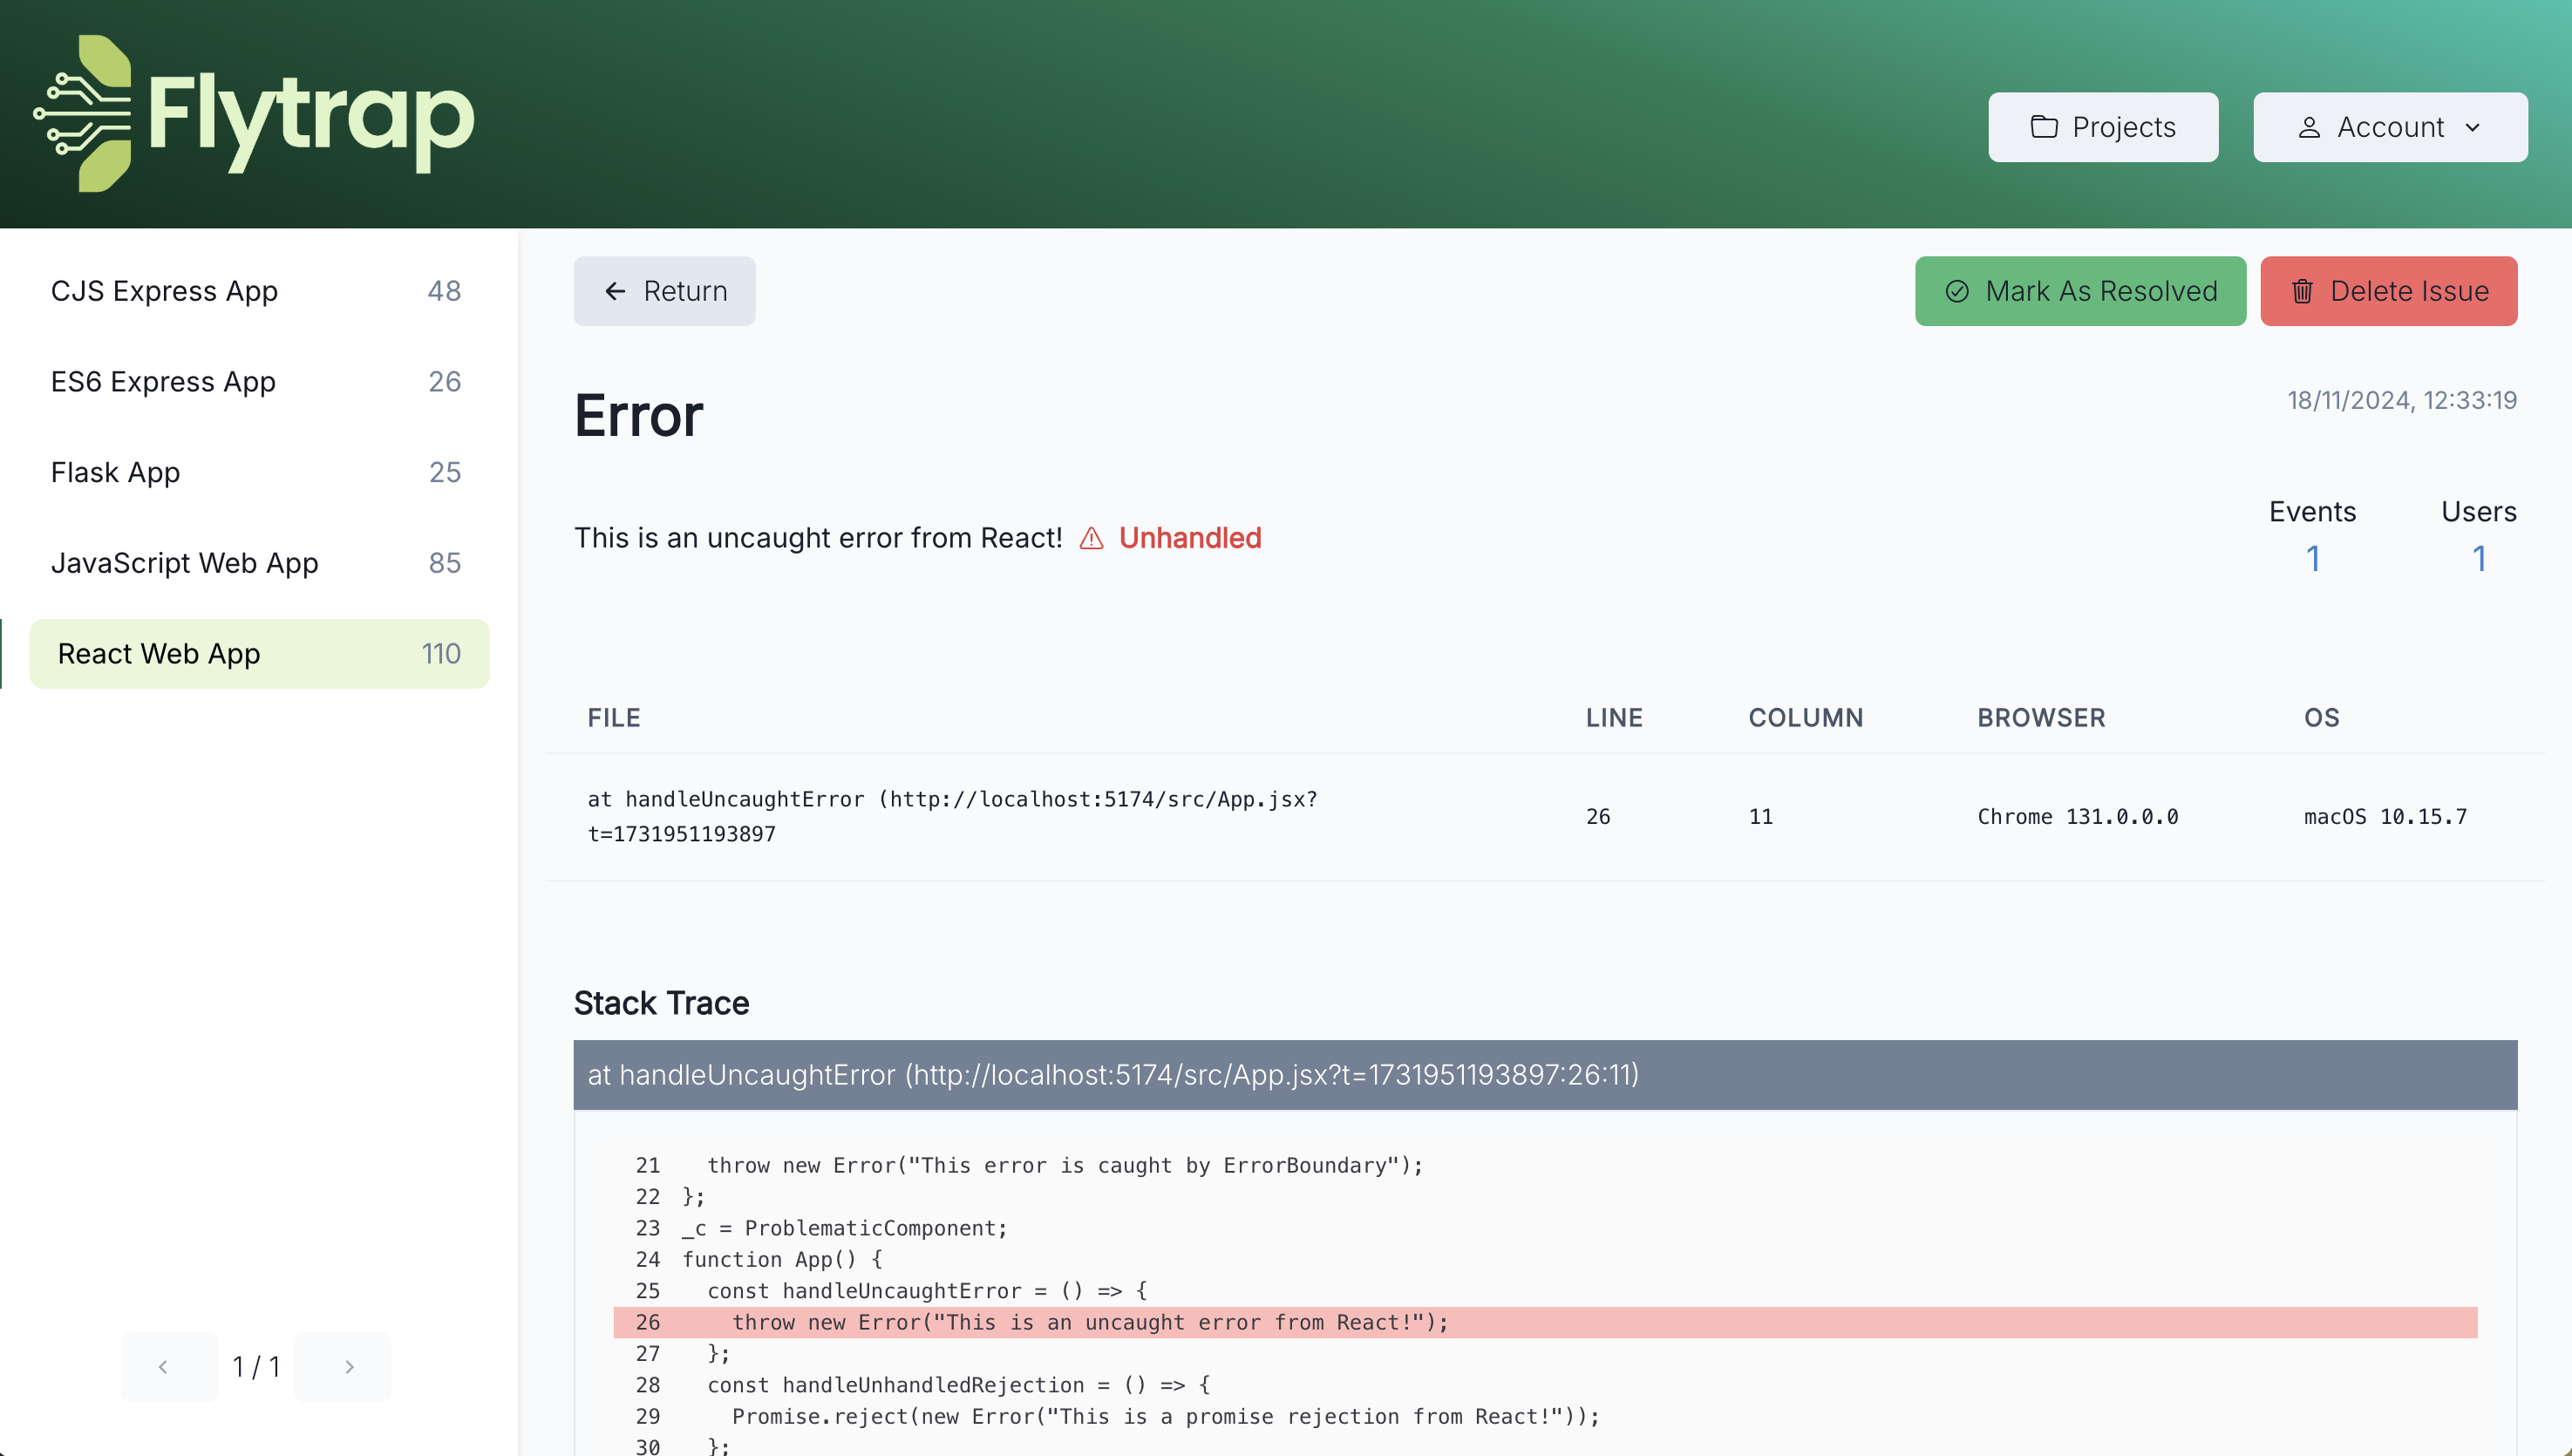
Interact with Stack Traces: Click on each line of the stack trace to expand and view the error line with red syntax highlighting, offering quick visual context.
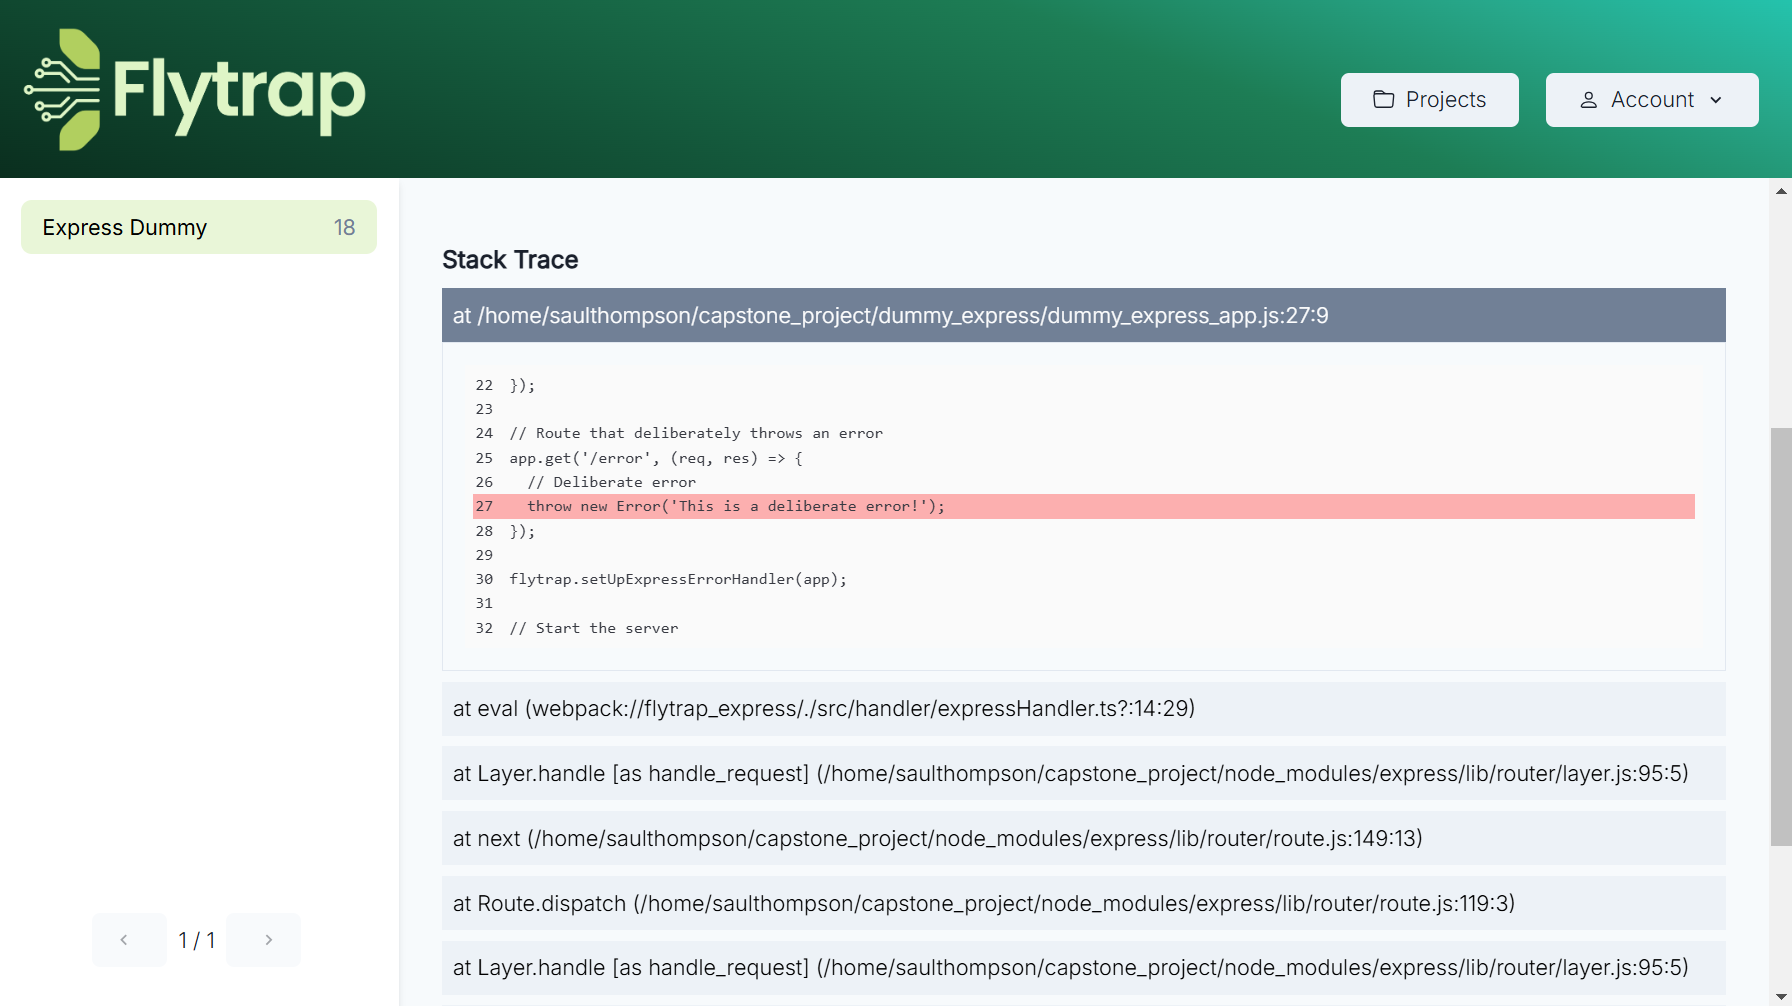
Additional Information:
- Resolve Errors:
- Mark as Handled: Indicate that an error has been addressed.
- Delete Errors: Remove errors that no longer need attention.
- Monitor User Impact: Flytrap tracks the number of users affected by each error, allowing you to prioritize fixes for issues that impact more users.
- Iterate and Improve: Continuously monitor your applications for new issues and ensure errors are resolved promptly to maintain application stability.
For questions or issues, feel free to contact the Flytrap team. 🚀